Oil markets lessen geopolitical risk while oversupply concerns remain

Oil, fundamental analysis
Crude prices fell to the lowest levels since the first week in May as geopolitical risk factors lessened and as another large gain in oil inventories was reported. The critical $60/bbl support mark for WTI was breached and a key technical indicator is now signaling that prices have moved too far below their recent average.
The US grade was as high as $62.90/bbl on Tuesday and as low as $58.70/bbl on Friday, having broken to the downside of the Lower-Bollinger Band limit at $$59.50. Brent crude hit its high on Thursday at $66.60/bbl with its low of $62.85/bbl occurring Friday as well. Both grades settled much lower week-on-week. The WTI/Brent spread has widened to ($4.25).
The announcement of a ceasefire agreement between Israel and Hamas has taken some of the geopolitical risk premium out of the crude markets temporarily. Israel has begun removing some troops from parts of Gaza as a hostage exchange is set to take place. However, past ceasefires have been violated by one side or the other.
The Trump administration continues to play tariff hardball with Iran and China, sanctioning a product export terminal in Iran and another refiner in China. The tariff issue continues to be viewed as a negative for global economic growth which is also bearish for oil prices.
In a counter move, China, which buys about 1.4-1.6 million b/d from Iran, is proposing to compensate Iran with infrastructure projects rather than a transfer of cash to circumvent the tariffs. And, despite the imposition of an additional 50% tariff on imports from India by the US, they are expected to increase the amount of oil imported from Russia over the coming months.
Russia was actually able to raise its output in September to 9.4 million b/d but still did not meet its OPEC+ quota.
Meanwhile, China buying oil for its stockpiles since the start of the year has aided an otherwise bleak global demand picture as it has helped offset the OPEC+ output increases to some extent. How long this underlying 1.0 million b/d market will remains unknown. Analysts are speculating that OPEC+ has very little spare capacity to meet its latest output goals which could indicate a market that will be short down-the-road.
The announced output increase from the group for November matched October’s 137,000 b/d increase while early assessments were double that amount.
Crude prices in Canada continue to improve as a result of the TransMountain pipeline’s deliveries to its west coast where volumes are exported to Asia. Canada’s Prime Minister Carney met with Pres. Trump this week and the subject of reviving the canceled Keystone XL pipeline was discussed. The proposed TC Energy 850,000-b/d project was sold and the new owners have no interest in pursuing it at this point.
Tanker-tracker, Vortexa, is reporting that there are about 1.2 billion bbl of oil currently in transit around the globe which is the most seaborne crude since 2016. And that doesn't account for so-called floating oil storage where tankers sit offshore waiting to unload or to be sold.
The Energy Information Administration’s (EIA) Weekly Petroleum Status Report (still released despite the government shut-down) indicated that commercial crude oil inventories for last week increased by 3.7 million bbl to a total of 420 bbl while total US oil production was 13.6 million b/d vs. 13.4 last year at this time. The Stretegic Petroleum Reserve was up 285,000 bbl to 407 million bbl.
US container imports fell 8.4% last month as the Trump tariffs disrupt global trade with Chinese deliveries down 22.9%. Analysts believe a peak has already occurred as buyers front-loaded their holiday purchases ahead of the imposition of the tariffs. Wall Street is reacting negatively to the new threat on increased tariffs on China as retaliation for their new rules on critical minerals exports and microchip imports.
On social media, Trump has said there is no reason for he and Xi Jinping to meet in two weeks as planned. All three major US stock indexes are lower week-on-week while the USD is higher which tends to suppress oil prices.
Oil, technical analysis
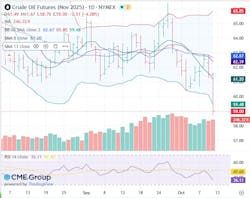
November 2025 WTI NYMEX futures prices plummeted from their 8-, 10- and 20-day Moving Averages this week and have breached the Lower-Bollinger Band limit, a Buy signal as it represents 2 Standard Deviations below the Mean.
Volume is around the recent average at 250,000. The Relative Strength Indicator (RSI), a momentum indicator, is now in oversold territory at 36, another potential Buy signal. Resistance is now pegged at $59.50 (Lower-Bollinger Band) while near-term critical Support is $58.70 (Friday’s Low).
Looking ahead
Presently, there is a stand-off on the US government shutdown which the markets are taking as a negative which, in turn, has been bearish for oil prices. Many analysts now foresee a global oil glut as we enter the third quarter.
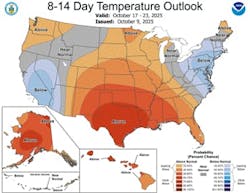
Gasoline demand picked-up last week which may be due to the above-normal temperatures most of the country is experiencing. The Tropics continue to impact the Central Atlantic and some of the US Southeast coastal areas. Thus far, the Gulf of Mexico has been spared the normal disruptions of the hurricane season. Below-normal temperatures are expected to move into the heating oil consuming region in the Northeast during the third week of October. Traders will then start to follow HO inventories in addition to the weekly crude reporting.
Natural gas, fundamental analysis
November NYMEX natural gas futures rose early week but fell on the above-forecasted storage injection and on the larger energy complex decline. The week’s High was $3.55/MMbtu on Wednesday while the week’s Low was $3.09 on Friday. Supply/Demand data was not available this week due to the shutdown.
Dutch TTF prices are holding at around $10.90/MMbtu while Asia’s JKM was quoted at $11.10/MMbtu. The EIA’s Weekly Natural Gas Storage Report indicated an injection of 80 bcf, below the forecasted 76 bcf. Total gas in storage is now 3.641 tcf, holding at just 0.6% above last year and to 4.5% above the 5-year average. Theoretically, there are just three weeks left in the injection season. To achieve a season-ending volume of 3.9 tcf, injections would have to average 86 bcf per week and 120 bcf to reach 4.0 tcf.
Natural gas, technical analysis
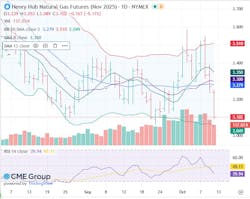
November 2025 NYMEX Henry Hub Natural Gas futures have also fallen below the 8-, 13-, and 20-day Moving Averages and are approaching the Lower-Bollinger Band limit. Volume was 135,000, around the recent average. The RSI is oversold at 40. Critical Support is pegged at $3.09 (Friday’s Low) with key Resistance at $3.20.
Looking ahead
Given last week’s storage injection, reaching a season-ending volume of 3.9 tcf now seems possible which could be bearish for the core winter strip of December/January/February. However, the storage spread for natural gas remains robust with November trading around $3.10/MMbtu while December is $3.80, and January is $4.15 for those with remaining capacity.
Again, the Tropics have not impacted Gulf of Mexico natural gas production. Next week could still see some demand as a result of A/C usage but the following week indicates below-normal temperatures moving into the heavily populated areas of the Northeast, bringing demand for space heating.
About the Author

Tom Seng
Dr. Tom Seng is an Assistant Professor of Professional Practice in Energy at the Ralph Lowe Energy Institute, Neeley School of Business, Texas Christian University, in Fort Worth, Tex.