Lower commodity prices drag down OGJ50 2024 earnings
In 2024, the 50 largest US oil and gas companies by assets posted strong growth in both total assets and shareholder equity, even as net income declined due to weaker commodity prices and narrowed refining margins. Operationally, the group expanded both liquids and natural gas reserves and production, on the back of steady capital investment and modest increases in drilling activity.
These gains were driven by extensive merger and acquisition activity across the sector.
The OGJ150 report has long served as a comprehensive benchmark for evaluating the performance of the largest US-based oil and gas companies. Initially covering 150 companies, this report provided valuable insights into the financial, production and reserves metrics of a broad spectrum of firms.
However, over the years, the US oil and gas sector has experienced substantial transformations due to mergers and acquisitions (M&A), leading to consolidation of the companies.
In response to this dramatic reduction in the number of oil and gas companies, the OGJ150 report has evolved into the current OGJ50 report. This change reflects the new reality of the industry, where the top 50 companies dominate the landscape in terms of assets and market influence. The OGJ50 report continues to provide critical insights into the industry's metrics but with a sharper focus on the most significant firms that shape the market.
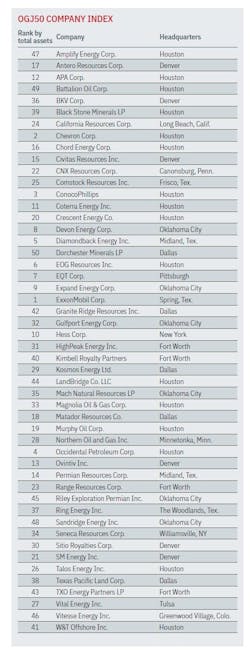
As before, to qualify for the OGJ50, oil and gas producers must be US-headquartered, publicly traded, and hold oil or gas reserves in the US. Companies that appear on the list are ranked by total yearend assets but are also ranked by revenues, earnings, capital expenditures, production, reserves, and US net wells drilled.
As usual, the data for this year's list reflects the operations of the previous year.
Oil market snapshot
In 2024, Brent crude oil averaged $81/bbl, down from $83/bbl in 2023. Prices fluctuated between $70/bbl and $93/bbl, reflecting a market shaped by ample supply, tepid economic growth, fuel substitution, and geopolitical tensions in the Middle East and Europe.
Global liquids demand growth slowed markedly in 2024, rising by just around 900,000 b/d compared with more than 2 million b/d in 2023. The deceleration was largely due to China, where post-COVID recovery had driven a 1.3 million b/d increase in 2023, but demand growth fell to just about 200,000 b/d in 2024 amid economic headwinds and a rapid transition to electric vehicles (EV).
Liquids supply grew by around 600,000 b/d in 2024—lagging demand growth. OPEC output declined by around 200,000 b/d as voluntary production cuts remained in place. These cuts, initially set for reversal in 2023, were repeatedly postponed due to weak market fundamentals. While regional conflicts occasionally spurred brief price spikes, the market quickly refocused on underlying supply-demand dynamics.
Global gas prices weakened in 2024, leading to higher gas demand. The early part of 2024 saw spot LNG prices fall to their lowest level since early 2022, but prices recovered by mid-year due to delays in the development of new supply capacity.
In Europe, TTF prices averaged $11/MMbtu in 2024, down 17% from 2023. Demand was weak due to warmer than normal winter weather early in the year, continued lower demand from the industrial sector, and high levels of renewable power generation. In Asia, Japan Korea Marker (JKM) averaged $12/MMbtu, 14% lower year-on-year. Through the first three quarters of 2024, JKM traded above TTF as constrained LNG supply and rising Chinese and Indian demand diverted cargoes eastward.
This reversed in the fourth quarter, with JKM slipping below TTF as cargoes were pulled to Europe.
In North America, the natural gas market was well supplied in 2024. Elevated wind and solar generation curbed gas demand, pushing Henry Hub prices down.
Gas producers responded by cutting output. Henry Hub spot hit a new all-time low of $1.24/MMbtu in March and $1.22/MMbtu in November. The 2024 average was $2.25/MMbtu, down from $2.56 in 2023 and $6.40 in 2022.
Refining margins declined in 2024 from the highs of 2022–2023. Early-year Red Sea disruptions and an active maintenance season briefly boosted margins in Europe. However, rerouted flows via the Cape of Good Hope and resuming refinery operations normalized margins later in the year. Weak demand weighed on margins, reflecting a stagnant Eurozone economy, muted Chinese growth, and softer US gasoline demand. Meantime, chemical cracker margins remained under pressure in 2024 because of global oversupply and weak demand.
OGJ50 group facts
ExxonMobil Corp. retains its status as the largest oil and gas company in the US, boasting assets exceeding $453 billion as of end-2024. In contrast, the smallest company in the ranking is Dorchester Minerals LP, with assets amounting to $367 million.
The list includes four limited partnerships (LP), including Mach Natural Resources, Kimbell Royalty Partners, Black Stone Minerals, and TXO Energy Partners.
Notably, four new companies made their debut on the OGJ50 in 2025: BKV Corp., Granite Ridge Resources Inc., LandBridge Co. LLC, and Texas Pacific Land Corp.
The survey reveals a divided financial landscape: 26 companies reported net incomes over $100 million, while 13 companies experienced net losses, with seven of those losing more than $100 million. Additionally, one company was noted to have negative shareholder equity.
Interestingly, no company on the list operates strictly as an “oil and gas only” firm, suggesting that even exploration-and-production-focused entities are now integrating midstream, marketing, or other verticals into their models. Additionally, royalty trusts remain below the OGJ50 threshold, indicating the list's focus on asset-heavy operational firms rather than passive royalty structures.
Only one subsidiary—Seneca Resources—was large enough to be featured, with over $2.6 billion in assets.
Group changes
The current OGJ50 list reflects significant changes among leading US oil and gas companies, driven by the wave of mergers, acquisitions, and corporate realignments.
Several well-known firms underwent ownership transitions or were absorbed into larger entities, contributing to the consolidation trend that continues to reshape the US oil and gas sector.
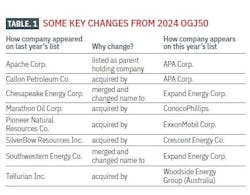
Among the notable changes, Apache Corp., previously listed under its full name, now appears as APA Corp., reflecting its role as the parent holding company.
Several companies dropped off the list following acquisition activity. Callon Petroleum, Marathon Oil, SilverBow Resources, and Tellurian Inc. were acquired by larger firms—Callon by APA, SilverBow by Crescent Energy, and Marathon Oil by ConocoPhillips.
Tellurian is now represented under Australia-based Woodside Energy Group.
Other companies, such as Chesapeake Energy Corp. and Southwestern Energy Co., underwent mergers that resulted in new corporate identities. Both now appear as part of Expand Energy Corp., a newly formed entity and the largest US natural gas producer.
Additionally, Pioneer Natural Resources Co., a major player in the Permian basin, was acquired by ExxonMobil Corp. in 2024. This high-profile transaction was one of the largest in recent years.
Chevron Corp.’s $53-billion all-stock deal to acquire Hess Corp. has closed following a decision in an arbitration dispute with Stabroek block partners ExxonMobil and CNOOC over Hess's stake in the offshore Guyana asset.
The panel ruled that the acquisition did not open the door for ExxonMobil to buy Hess’ non-operated interest in the block. Overall, these changes reflect broader industry trends, particularly the drive toward scale, efficiency, and capital consolidation.
2024 vs. 2023
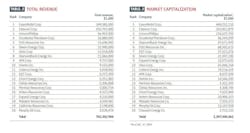
Due to massive consolidation, the total assets of the top 50 companies grew substantially in 2024. Combined assets increased to $1.40 trillion in 2024 from $1.18 trillion in 2023, reflecting an 18.3% increase. Total revenue rose slightly to $792.7 billion in 2024 from $788.6 billion in 2023, an increase of 0.5%.
Net income, however, declined significantly due to lower commodity prices and narrowed refining margins.
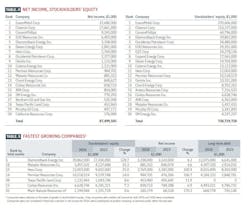
In 2023, the top 50 companies generated $112.9 billion in net income, which dropped to $87.4 billion in 2024, a decline of 22.5%.
Stockholders’ equity grew to $783.6 billion from $656.0 billion, marking a 19.45% increase.
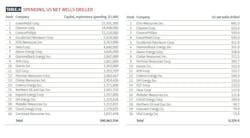
Capital and exploration expenditure rose modestly, increasing to $110.6 billion in 2024 from $106.8 billion in 2023, a 3.6% gain. This indicates a measured approach for upstream investment, emphasizing disciplined capital allocation and selective project development.
Operationally, the top 50 companies demonstrated meaningful increases in both production and reserves at both the national and international levels.
Worldwide liquids production grew to 4,340.5 million bbl in 2024 from 3,714.8 million bbl in 2023, an increase of 16.84%. Worldwide natural gas production increased nearly 8%, to 18.95 trillion cubic feet (tcf) from 17.55 tcf. With the increase in global production, global reserves also saw significant growth. Worldwide liquids reserves climbed 16.12%, to 45,394.3 million bbl from 39,092.4 million bbl. Worldwide natural gas reserves rose 5.73%, to 210.2 tcf from 198.8 tcf.
Domestically, production followed a similar upward trend. US liquids production rose around 19%, increasing to 3,205.7 million bbl in 2024 from 2,694.2 million bbl in 2023. Natural gas production increased to 14.78 tcf from 13.4 tcf, a 10.3% gain. US reserves also posted solid gains. The group’s US liquids reserves grew to 32,610.6 million bbl in 2024 from 27,266.2 million bbl in 2023—an increase of 19.6%. Natural gas reserves rose 10.23%, to 171.9 tcf from 155.95 tcf.
Finally, the group’s drilling activity showed a modest increase. US net wells drilled increased to 5,835.5 in 2024 from 5,746.4 in 2023, up 1.55%. This aligns with the slight increase in capital expenditures.
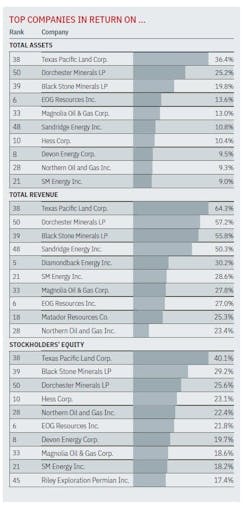
Notably, the 2024 OGJ50 data highlight a high concentration of financial and operational performance among the top 20 (by assets) publicly traded US oil and gas companies. The top 20 companies held over 93% of the total assets reported by the top 50, while accounting for more than 96% of total revenue and 97% of total net income.
Earnings leaders
The 2024 OGJ50 net income rankings reflect a notable reshuffling among top-performing US oil and gas companies. While supermajors like ExxonMobil, Chevron, and ConocoPhillips continue to dominate in profitability, a shift is visible among the second tier, where new players have emerged.
Overall, companies’ earnings declined compared with 2023, primarily due to lower oil and natural gas prices, which compressed earnings despite higher production levels.
ExxonMobil retained its position as the most profitable US oil company, reporting a net income of $33.68 billion for 2024. This marks a decrease from the $36.01 billion earned in 2023 and $55.74 billion in 2022, reflecting lower commodity prices and reduced refining margins.
ExxonMobil successfully closed the Pioneer Natural Resources acquisition in May 2024, significantly increasing its Permian basin footprint. Total production volumes averaged around 1.18 MMboe/d in 2024, about 570,000 boe/d higher than the previous year. ExxonMobil expects to roughly double production in the Permian basin by 2030.
Similarly, Chevron retained its second-place position, with earnings dropping to $17.66 billion in 2024 from $21.37 billion in 2023. The company’s worldwide net oil-equivalent production in 2024 was 3.3 million b/d, 7% higher than in 2023 primarily due to a full year of legacy PDC Energy Inc. (PDC) production and growth in the Permian basin.
In January 2025, Tengizchevroil LLP (TCO) started oil production at its Future Growth Project, which is expected to contribute to higher free cash flow. Chevron’s downstream
earnings decreased by $3.4 billion in the US and $1 billion internationally mainly due to lower margins on refined product sales.
ConocoPhillips remained in third place with $9.25 billion, down from $10.96 billion the previous year. In November 2024, ConocoPhillips acquired Marathon Oil in a $22.5 billion all-stock transaction, adding high-quality, low-cost supply inventory in the Eagle Ford, Bakken, and Permian basin. The company also reached first oil at new sites in Norway, Alaska, and China.
Other companies such as EOG Resources Inc., Diamondback Energy Inc., and Devon Energy Corp. followed in the ranking but also posted lower net income compared with 2023, driven by weaker oil and natural gas prices.
Hess Corp., now the seventh most profitable company in 2024, reported $2.77 billion in earnings, up significantly from $1.38 billion in 2023. Net production averaged 481,000 boe/d in 2024 and 394,000 boe/d in 2023.
The average realized crude oil price was $77.28/bbl in 2024 and $75.97/bbl, including the effect of hedging, in 2023. As noted previously, its now-closed merger with Chevron had been delayed by a dispute involving Stabroek block partners ExxonMobil and CNOOC.
Occidental Petroleum Corp. reported a decline in earnings to $2.38 billion, down from $3.77 billion in the previous year, while Ovintiv Inc. experienced a decrease to $1.13 billion from $2.09 billion.
Several companies that were among the top earners in 2023 did not appear in the 2024 top 20 list. These companies include Pioneer Natural Resources Co., which was acquired by ExxonMobil; Apache Corp., currently listed under APA Corp.; Chesapeake Energy Corp. and Southwestern Energy Co., both of which merged into Expand Energy Corp.
Others, including EQT Corp., CNX Resources Corp., and Gulfport Energy Corp., fell below the top 20 threshold.
Leaders in capital spending, drilling
ExxonMobil retained its position as the top spender, allocating $27.5 billion in 2024, up from $26.3 billion in 2023. Chevron also held steady at second place with $16.4 billion, up from $15.8 billion the prior year.
ConocoPhillips remained in third place, increasing its spending to $12.1 billion from $11.2 billion a year ago.
Occidental Petroleum and EOG Resources ranked fourth and fifth in both years, with Occidental increasing its spending to $7.0 billion in 2024 from $6.3 billion, while EOG largely kept its spending level consistent with that of the previous year.
Drilling rankings revealed notable shifts. EOG Resources led the sector with 641 net wells drilled in 2024, a slight increase from 640 in 2023, moving up from second to first.
Chevron and ConocoPhillips closely trailed with 633 and 559 wells, respectively. Notably, Chevron's well count decreased from 701 in 2023. ExxonMobil increased its drilling activity, with 545 wells drilled compared with 447 the previous year.
New entrants to the top drillers in 2024 included Crescent Energy Corp. and Vital Energy Inc., replacing companies like Callon Petroleum Co. and HighPeak Energy Inc. that appeared in 2023.
Leaders in liquids reserves, production
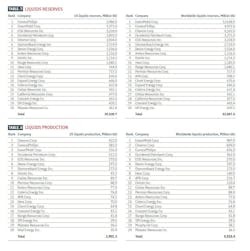
In 2024, ConocoPhillips secured the leading position in US liquids reserves with 3.99 billion bbl, a notable rise from 3.40 billion bbl in 2023. The company’s reserve replacement was 244% in 2024, benefiting from development drilling activity; extensions and discoveries;
and purchases, including its acquisition of Marathon Oil; partially offset by lower prices.
This boost allowed the company to surpass ExxonMobil and EOG Resources, which ranked second and third in this category, respectively, in 2024.
ExxonMobil improved markedly in US liquids reserves, moving from fifth place in 2023 with 2.10 billion bbl to second place in 2024 with 3.27 billion bbl—a striking 56% increase. This sharp jump is primarily attributable to its acquisition of Pioneer Natural Resources.
EOG Resources experienced slight growth in its US liquids reserves, rising to 3.23 billion bbl in 2024 from 3.01 billion bbl in 2023.
In contrast, Chevron saw a reduction in its US liquids reserves, decreasing to 2.83
billion bbl in 2024 from 2.97 billion bbl in 2023, which caused it to fall to fifth place from third in the latest rankings. The decrease can be attributed to failure to replace production volume through new discoveries or extensions, along with asset sales.
Diamondback Energy more than doubled its reported liquids reserves to 2.72 billion bbl from 1.68 billion bbl, reflecting added reserves from the Endeavor Energy acquisition
and the proved reserves obtained through the Viper Tumbleweed acquisitions.
Other mid-sized players such as Devon Energy, Antero Resources, Ovintiv, and Hess maintained relatively stable reserve bases with modest year-over-year gains.
From a global perspective, ExxonMobil maintained a commanding lead in global reserves, surging to 12.64 billion bbl in 2024 from 10.06 billion bbl in 2023—a nearly 26% increase, reinforcing its position as the global liquids reserves leader.
Throughout the year, ExxonMobil conducted development activities that led to the reclassification of around 1.1 billion boe from proved undeveloped reserves to proved developed reserves by the end of the year. The most significant transfers were linked to development projects in the US, Guyana, Kazakhstan, and the United Arab Emirates (UAE).
In 2024, the acquisition of 0.4 billion boe in the US, along with the discovery and extension of 1.9 billion boe—primarily in the US and Guyana—contributed to an increase of about 2.3 billion boe in proved undeveloped reserves.
ConocoPhillips also grew significantly on the global stage, with reserves increasing to 4.55 billion bbl from 3.92 billion bbl.
Occidental Petroleum increased its reserves to 3.37 billion bbl from 2.92 billion bbl, overtaking EOG Resources, which also grew modestly to 3.23 billion bbl from 3.01 billion bbl. In 2024, Occidental converted about 27% of its proved undeveloped reserves to proved developed reserves, when adjusted for revisions and sales.
On the production front, Chevron retained its top position in US liquids production in 2024 with 422 million bbl, up from 364 million bbl in 2023. ConocoPhillips followed closely, growing production to 381 million bbl from 361 million bbl. ExxonMobil, along with significant reserve growth, saw a production boost—to 316 million bbl from 203 million bb—placing it third in US liquids output.
Globally, ExxonMobil expanded its lead significantly, growing to 987 million bbl in 2024 from 784 million bbl in 2023. Chevron and ConocoPhillips followed in second and third positions, increasing outputs to 609 and 456 million bbl from the previous year’s 558 million bbl and 429 million bbl, respectively.
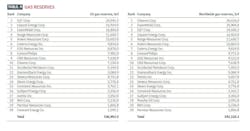
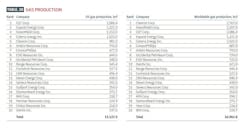
Leaders in natural gas reserves, production EQT Corp. retained its dominant position as the largest holder of US natural gas reserves, with 24.55 tcf in 2024. Although this declined from 25.80 tcf in 2023.
Expand Energy, a new entrant formed in October 2024 through the merger of Chesapeake Energy and Southwestern Energy, made a significant debut with 16.92 tcf of US gas reserves, taking second place.
ExxonMobil’s US natural gas reserves surged to 16.84 tcf in 2024 from 12.26 tcf in 2023. Range Resources, Antero Resources, and Coterra Energy held steady in the mid-tier, each maintaining focus in prolific shale plays such as Marcellus and Anadarko. Their reserve levels saw only marginal fluctuations.
EOG Resources and ConocoPhillips also reported moderate growth in US gas reserves, with the former rising to 8.88 tcf from 8.63 and the latter jumping to 7.98 tcf from 6.90 tcf.
Globally, Chevron maintained the top spot with 26.53 tcf, though this marked a 6.3% decrease from its 2023 total of 28.32 tcf. The company remains the global leader
in gas reserves, supported by its robust LNG portfolio and international assets in key regions such as Australia and West Africa.
ExxonMobil narrowed the gap, increasing its worldwide gas reserves to 25.90 tcf in 2024 from 21.96 tcf in 2023. The company's rising position aligns with its push for LNG growth in Guyana, Mozambique, and the US.
EQT Corp. has fallen to third place globally, down from second place last year. Meanwhile, Expand Energy claimed fourth place globally with the same 16.92 tcf seen in its US reserves, suggesting a purely domestic gas portfolio.
Further down, Range, Antero, and Coterra held steady, while ConocoPhillips expanded its global reserves significantly to 9.77 tcf from 8.44 tcf.
As the dominant Appalachian producer, EQT Corp. retained its leadership in US gas production, increasing output to 2.08 tcf in 2024 from 1.91 tcf in 2023. Expand Energy was the second-largest US gas producer in 2024 with 1.32 tcf. ExxonMobil advanced its US gas output to 1.15 tcf from 957 billion cubic feet (bcf), reflecting its broader push into shale gas, particularly in the Permian basin and Haynesville.
Chevron, despite its focus on global operations, raised its US gas production to 981 bcf in 2024 from 771 bcf in 2023. Antero Resources and ConocoPhillips maintained output levels. Occidental Petroleum increased its US natural gas production to 548 bcf in 2024 from 480
bcf in 2023.
Globally, Chevron remained the largest gas producer, with worldwide output rising to 2.77 tcf in 2024 from 2.61 tcf in 2023. ExxonMobil followed closely, growing its global gas production to 2.21 tcf in 2024 from 2 tcf in 2023, driven by both US and international expansion in Guyana, Qatar, and Mozambique.
Fast-growing companies
The ranking for the OGJ50 list of the fastest growing companies is based on growth in stockholders’ equity. Other qualifications are that companies are required to have positive net income for 2024 and 2023 and have an increase in net income in 2023. Subsidiary companies, newly public companies, and limited partnerships are not included.
Diamondback leads the fastest-growing list in 2024, more than doubling its equity base, reflecting its $26 billion acquisition of Endeavor Energy. The sharp rise in long-term debt suggests leveraged expansion. Despite the increase in debt, Diamondback generates strong free cash flow.
Matador continues its upward trajectory with healthy gains in equity and income. Hess posted an impressive doubling of net income in 2024, driving strong equity gains. The company’s long-term debt remained relatively stable, indicating controlled financing despite growth. Its focus on offshore Guyana and Bakken development continues to deliver value.
Permian Resources recorded one of the highest income growth rates among peers. The combination of moderate equity growth and rising income suggests efficient production scaling in the Permian basin.
Although equity growth was modest, Mach Natural Resources achieved the highest net income growth rate among the listed companies. The sharp rise in earnings and concurrent reduction in long-term debt suggest improving operational efficiency and strong cash flow.
Historical spreadsheets of data presented here are available for purchase from Oil & Gas Journal Research Center.
About the Author

Conglin Xu
Managing Editor-Economics
Conglin Xu, Managing Editor-Economics, covers worldwide oil and gas market developments and macroeconomic factors, conducts analytical economic and financial research, generates estimates and forecasts, and compiles production and reserves statistics for Oil & Gas Journal. She joined OGJ in 2012 as Senior Economics Editor.
Xu holds a PhD in International Economics from the University of California at Santa Cruz. She was a Short-term Consultant at the World Bank and Summer Intern at the International Monetary Fund.

Laura Bell-Hammer
Statistics Editor
Laura Bell-Hammer is the Statistics Editor for Oil & Gas Journal, where she has led the publication’s global data coverage and analytical reporting for more than three decades. She previously served as OGJ’s Survey Editor and had contributed to Oil & Gas Financial Journal before publication ceased in 2017. Before joining OGJ, she developed her industry foundation at Vintage Petroleum in Tulsa. Laura is a graduate of Oklahoma State University with a Bachelor of Science in Business Administration.