Oil markets turbulent amid tariffs, OPEC+ supply hikes
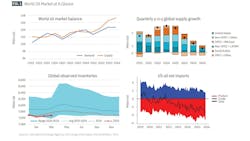
After reaching a high of $81/bbl on Jan. 15, the spot price of West Texas Intermediate (WTI) crude oil fell sharply in April to below $60/bbl, the lowest level in 4 years. The decline was mainly driven by market concerns about weak crude oil demand and the imposition of trade tariffs by the US.
The two key players in the escalating trade conflict, the US and China, are also the world's largest crude oil consumers, accounting for about 20% and 16%, respectively, of the estimated 104 million b/d of global demand in 2024. Therefore, any economic deceleration centered on these two economies may significantly dampen global oil demand outlook.
Nonetheless, the oil market saw a significant rise after the breakthrough in the US-China trade negotiations on May 11, 2025. The agreement reached by the two countries to temporarily reduce tariffs significantly improved market sentiment, leading to an increase in oil prices.
However, considerable uncertainties remain.
On the supply side, OPEC+ members have accelerated planned production increases. On May 3, eight member countries announced a collective output hike of 411,000 b/d for June—the second consecutive month of ramped-up production. This strategy of increasing volumes at the expense of prices has introduced a bearish undertone to the market. The evolving pace of unwinding production cuts, coupled with inconsistent compliance across member nations, is further contributing to supply-side uncertainty.
Meanwhile, the US has introduced new sanctions targeting Iranian and Venezuelan oil. The Trump administration has warned that entities purchasing Iranian oil or petrochemical products could face secondary sanctions, a policy similar to measures previously applied to Venezuelan crude. Notably, the fourth round of US-Iran nuclear negotiations concluded in early May, raising the possibility of a future agreement. Market uncertainty now hinges on how US policy toward Iran, Russia, and Venezuela will ultimately shape overall global supply.
Despite the Trump administration’s pro-production stance, US light tight oil (LTO) output is beginning to lose momentum. With oil prices falling below $60/bbl, drilling activities are becoming less economically feasible for some producers, posing a risk to supply growth.
However, the non-OPEC+ group is projected to reach record production levels in 2025 and 2026, driven by the launch of significant new conventional offshore projects.
Ongoing geopolitical tensions—most notably the Russia-Ukraine war and conflicts in the Middle East—continue to threaten global oil supply, heightening the risk of price volatility. The potential for renewed or escalating hostilities poses a serious threat to energy trade flows and overall supply stability.
World economy
In its April World Economic Outlook report (WEO), the International Monetary Fund (IMF) made notable cuts to its global growth forecast, cautioning that increasing trade tensions and greater policy uncertainties are expected to significantly affect global economic activity.
Based on the tariff measures announced, the IMF projects global economic growth to fall to 2.8% in 2025 and to 3.0% in 2026—well below the January forecast of 3.3% for both years. The IMF also slashed its 2025 US economic growth forecast by 0.9 percentage points to 1.8%, marking the largest downward revision among major advanced economies. The IMF also cut its 2025 GDP projections for China and India to 4% and 6.2%, respectively, down from its January forecast of 4.6% and 6.5%.
In light of the US-China trade agreement on May 11, institutions have revised forecasts upward. JPMorgan has increased its 2025 GDP growth forecast for China to 4.8% from 4.1%. The bank also lowered its estimated probability of a US recession in 2025 to below 50% from 60%. Future pauses, concessions, exemptions, and negotiations are expected to diminish both the permanence and economic effects of the levies.
According to the US Bureau of Economic Analysis (BEA), the US economy contracted by 0.3% in first-quarter 2025. This marks the first quarterly contraction since first-quarter 2022. The University of Michigan published its April consumer survey report, revealing that the consumer sentiment index in the US fell to 52.2, an 8.4% decline from March and a 32.4% drop compared with the same time last year.
However, the US April non-farm payrolls data exceeded expectations, with the US economy adding 177,000 jobs, surpassing a forecast of 138,000. The unemployment rate remained steady at 4.2%. The Federal Reserve decided to maintain interest rates at current levels in its May FOMC meeting but noted rising risks of higher inflation and unemployment.
Meantime, China is sliding deeper into economic weakness, exacerbated by external shocks. In response to economic pressures, the People's Bank of China has implemented monetary easing policies, including interest rate cuts and reduced reserve requirements, injecting liquidity into the economy.
The economic performance of Europe has exceeded expectations in first-quarter 2025, with the eurozone experiencing an annualized GDP growth of 1.4%, matched by a similar growth rate in the UK.
The HCOB Eurozone Manufacturing PMI has consistently improved over the first 4 months of the year. Additionally, the recent comparative strength of regional stock markets, anticipated increases in government spending, and declining energy prices are expected to provide additional support to the economy.
Global oil demand
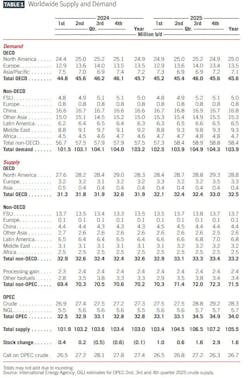
The International Energy Agency (IEA) revised its forecast for global oil demand growth in 2025, lowering it from 1 million b/d in its January report to 740,000 b/d in the latest update. This revision is related to global economic challenges and record sales of electric vehicles (EV).
US-China trade negotiations and the subsequent 90-day reprieve have alleviated some demand side pessimism; however, lasting impact on trade flows remains.
Nonetheless, there are also certain tailwinds at play. Decreasing oil prices are likely to increase consumption. In many countries, retail prices for gasoline and gasoil have already dropped to their lowest levels in several years, and further reductions are anticipated as the
effects of April's price slump are reflected at the pump. In this context, a weak US dollar provides a further benefit for importing nations.
Although the outlook has been downgraded, oil consumption saw a strong year-on-year increase of 1.2 million b/d in first-quarter 2025, marking the fastest growth since 2023. This surge was largely driven by a colder-than-average winter, which increased the demand for heating fuel. Nevertheless, growth for the remainder of the year is anticipated to weaken.
Emerging Asian economies remain the primary engines of demand expansion. In 2025 and 2026, they are projected to account for most of the total growth, with petrochemical feedstocks such as naphtha, LPG, and ethane leading product-level increases. Meanwhile, the demand for transport fuels is slowing.
China’s oil demand growth is now forecast at 134,000 b/d in 2025, down from a January projection of 220,000 b/d, amid trade hostilities with the US and a slowing economy.
Demand for petrochemical feedstocks is expected to continue to grow rapidly, while demand for fuel products is gradually declining due to the widespread adoption of EVs.
Indian oil demand is expected to grow 127,000 b/d in 2025, driven by rising demand for gasoline and LPG.
Conversely, demand in OECD countries is projected to decline by 120,000 b/d in 2025 and by a further 240,000 b/d in 2026. Gasoil and naphtha face the sharpest contractions due to subdued industrial activity and the closure of European petrochemical plants. TotalEnergies intends to close one of its two steam crackers in Antwerp by end-2027. Meanwhile, Dow Chemical is conducting a strategic review of its European operations, which could lead to the closure of its cracker in Bohlen, located in eastern Germany.
World oil supply
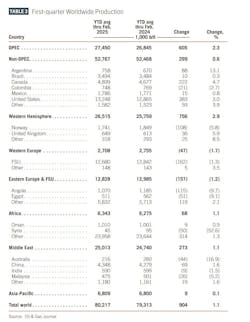
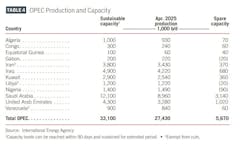
On Apr. 3, the eight OPEC+ nations (Saudi Arabia, Russia, Iraq, UAE, Kuwait, Kazakhstan, Algeria, and Oman) that agreed to voluntary production adjustments for 2023 opted to reinstate 411,000 b/d in May, a number that is three times the 137,000 b/d increase set for April 2025. On May 3, the OPEC-8 group decided to repeat the same 411,000 b/d increase for June.
If sustained, this trajectory will restore nearly 2.2 million b/d of restrained output by October 2025, nearly a year ahead of the original schedule. While not all core OPEC+ members are expected to contribute, the accelerated increases are significant enough to reshape the oil market balance. The decision marks a pivotal end to the supply management strategy initiated in April 2020 under Saudi Arabia's leadership, signaling a bearish turn in market outlook and altering the price stability landscape that OPEC+ had maintained since the COVID-19 pandemic.
According to analysis from energy investment firm Piper Sandler, this strategic pivot reflects a broader recalibration of priorities within Riyadh. Rather than focusing on price defense through supply management, Saudi Arabia appears to be leveraging oil supply as a geopolitical tool. This includes exerting influence over Iraq, navigating the complexities of regional security with US support, and preparing for potential disruptions stemming from sanctions against Venezuela, Iran, and Russia.
Meantime, the collapse of consensus within OPEC+, especially in light of Kazakhstan and Iraq’s overproduction, appears to have catalyzed Saudi Arabia’s decision to abandon its leading role in enforcing group discipline. Rather than adhering to OPEC+’s quota restrictions, Kazakhstan has stated its commitment to prioritizing national interests by signaling plans to boost production. The involvement of US companies such as ExxonMobil and Chevron contributes to this increase in supply. Chevron’s Tengiz expansion project reached full capacity in February 2025.
In sum, the OPEC+ supply hikes confirm a decisive and bearish strategic shift away from managed markets. As the cartel’s coherence wanes and geopolitics increasingly drive energy policy, oil markets are entering a more volatile phase—marked by increased supply risk, geopolitical fragility, and uncertainty over future cooperation among producers. Nonetheless, production of many other member countries is already in a state of natural decline, which could facilitate OPEC+’s recent actions.
Meantime, market uncertainty now hinges on how US policy toward Iran, Russia, and Venezuela will ultimately shape overall global supply. In April, Venezuela produced 840,000 b/d, a decrease of 130,000 b/d from the previous month. Meanwhile, the US and Iran concluded a fourth round of nuclear talks in Oman in May, aiming to limit Iran's nuclear activities in exchange for sanctions relief. Both sides described the discussions as productive. If an agreement is reached, it could push Brent prices down toward the $50/bbl range due to an increase in market supply.
Outside the OPEC+ group, significant developments are also taking place. According to IEA’s forecasts, the contribution from US LTO is projected to account for only about 15% of the 920,000 b/d growth in 2026.
This marks a decrease from the 20% share in 2025 and is less than half of the 35% contributions seen in both 2023 and 2024. Meantime, between early 2025 and December 2026, major new conventional offshore projects are expected to add 2 million b/d to global output.
Brazil is anticipated to be the largest contributor to this increase, followed by Guyana, the US, and Norway.
Brazil is on track to introduce five new floating production storage and offloading (FPSO) vessels between 2025 and 2026, in addition to the eight new units that have already been commissioned over the past 2 years. The five FPSOs scheduled for this year and next will contribute an additional 1 million b/d of production capacity, with oil supply capacity projected to reach 3.9 million b/d by 2026.
Guyana will see supply rise by 80,000 b/d on average after the Yellowtail FPSO is commissioned in third-quarter 2025. Growth in 2026 is forecast at 160,000 b/d as the fifth FPSO, Uaru, is brought online.
US offshore production capacity is expected to increase by over 275,000 b/d this year as four major projects start up, including Shell’s recently commissioned Whale field.
Global oil inventories
According to data from IEA, global observed oil inventories increased by 25.1 million bbl in March 2025, reaching 7.67 billion bbl but remained 221 million bbl below the 5-year average. Total OECD inventories increased by 3.1 million bbl.
Preliminary data show global oil inventories built further in April. Overall, global oil inventories are projected to be on an upward trajectory, driven by a combination of robust supply growth and moderating demand. If OPEC+ maintains its plan to increase production and/or there is no definitive alleviation of tariff concerns, there remains a downside risk for oil prices.
US oil demand
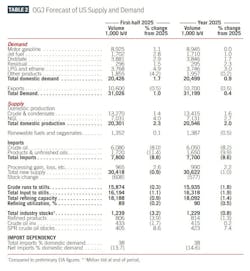
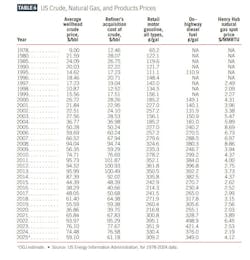
Data from US Energy Information Administration (EIA) indicates total petroleum consumption averaged 20.43 million b/d in first-half 2025, representing a 1.73% increase from the 20.1 million b/d recorded during the same period in 2024. In first-quarter 2025, US oil demand rose by 510,000 b/d compared with the previous year, marking the largest monthly increase in nearly 3 years, reflecting cold-weather-related heating needs. For full-year 2025, US oil demand is forecast to increase by 0.9% to 20.5 million b/d.
US motor gasoline consumption is projected to level off in 2025 compared with 2024, reflecting efficiency improvements and a maturing gasoline demand curve.
During first-half 2025, motor gasoline demand increased by 1% compared with first-half 2024. Despite the pessimistic views of economists and the turbulence in financial markets, key indicators of US economic activity remained relatively stable. Consumers enjoyed a roughly 10% year-over-year reduction in pump prices. The job market, which is a crucial factor influencing gasoline consumption, continued to show strength.
Diesel demand surged in January following winter Storm Enzo. Meantime, with the US economy is maintaining moderate growth and demand for freight transport remains resilient, supporting higher diesel usage. Unlike passenger cars that have seen notable fuel efficiency improvements and EV adoption, the heavy-duty trucking sector still largely depends on diesel with fewer alternatives. However, tariffs and disruption to supply chains are likely dampening demand from the transportation and manufacturing sectors.
LPG/ethane demand from the petrochemical sector is driving US consumption growth. For 2025 overall, petrochemical feedstock demand is expected to grow by around 110,000 b/d, supported by rising petrochemical consumption and higher residential/commercial usage from the winter.
US jet fuel demand is expected to rise further in 2025 compared with 2024 but remain below the pre-pandemic level. Recent data from EIA indicates that during first-half 2025, jet fuel demand increased by nearly 3% compared with first-half 2024.
US oil production
US crude oil production growth is expected to slow in 2025 as lower oil prices and heightened trade frictions take a toll on investment and drilling activity.
The downward trend follows a sharp drop in oil prices, with WTI crude briefly falling below $57/bbl in early April—well under the average price needed by US shale producers to profitably drill new wells, according to the Dallas Fed Energy Survey. Rising costs for equipment and steel, exacerbated by the latest wave of US import tariffs, are further pressuring drilling economics.
Nonetheless, US oil output is still on track to reach record levels in 2025, driven by existing projects and a modest rebound from earlier weather-related disruptions. However, growth in LTO production is forecast to decelerate for the third consecutive year, increasing by just 260,000 b/d in 2025 and a further 110,000 b/d in 2026.
US Lower 48 tight oil well costs are under upward pressure from new tariffs, though overall cost increases are expected to be tempered by price declines in key service categories.
Analysis by Wood Mackenzie shows tariffs on consumables—including imported steel, oil country tubular goods (OCTG), cement, and drilling fluids—are driving near-immediate cost increases that will be passed directly to operators. Although operators are experiencing increased costs in certain areas, these will largely be balanced out by deflation in others.
Falling prices for proppant, drilling rig services, and pressure pumping are expected to lower
expenses this year.
As oil prices fluctuate, shale oil producers are seeing deteriorating profit expectations, leading to reduced willingness to increase production. According to the Dallas Fed's energy survey at the end of the year’s first quarter, producers expect the average breakeven price for new wells this year to be around $65/bbl WTI. At lower price levels, shale producers may adopt a more cautious approach to capital expenditures, which could hinder production growth.
Independent producers are beginning to cut back on 2025 capital spending plans.
Diamondback Energy Inc. has cut its original 2025 capital spending plans by $400 million, or 10% of the previous midpoint estimate, and similarly lowered the target for wells drilled and completed. The company also is dropping three of its 15 rigs.
EOG Resources Inc. has recently taken $200 million out of its 2025 capital spending plan and lowered its production growth guidance. ConocoPhillips also revised its 2025 capital expenditure budget downward, to $12.3-12.6 billion from the previously planned $12.9 billion, due to ongoing economic uncertainty and volatile oil prices. Permian Resources reduced its capital budget by $50 million. Devon and Occidental Petroleum also trimmed spending plans.
Shale wells experience significantly higher initial decline rates compared with conventional wells, which means that maintaining production levels in a basin requires a substantial annual volume of new wells. These replacement volumes depend on the level of drilling activity and the productivity of each well.
Last year, there were notable efficiency improvements in well productivity, including application of AI technology, reduced drilling time, and shortened hydraulic fracturing processes, which offset the effects of lower-than-expected drilling activity. However, for 2025 and 2026, the pace of efficiency gains will likely begin to slow, creating challenges for production growth.
Between January 2024 and April 2025, the number of drilled but uncompleted wells (DUCs) declined to 5,332 from 5,977, reflecting a continued drawdown in the inventory of previously drilled wells, according to EIA’s Drilling Productivity Report.
Meanwhile, the Gulf of Mexico is projected to experience a strong increase in crude oil production in 2025, thanks to major new projects coming online. US offshore production capacity is projected to rise by over 275,000 b/d this year with the startup of four significant projects, including Shell's newly launched 80,000 b/d Whale field. The initial phase of Beacon Offshore Energy's 120,000 b/d Shenandoah development is expected to contribute 60,000 b/d to the market.
Additionally, Chevron's 75,000 b/d Ballymore and LLOG Exploration's 60,000 b/d Leon/Castile projects will also support a total supply increase of 120,000 b/d in the Gulf this year, followed by another 60,000 b/d next year.
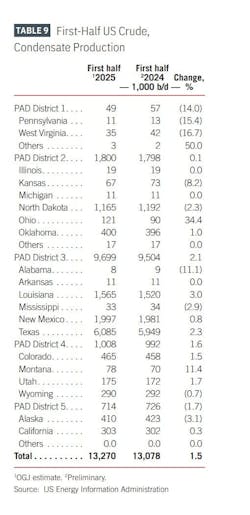
Overall, OGJ forecasts that US crude oil production will average 13.4 million b/d for full-year 2025, a 1.6% rise from the 2024 level.
US natural gas liquids (NGL) production is projected to rise by 2.7% in 2025, reaching a total of 7.13 million b/d. In first-quarter 2025, the composite price of NGL at Mont Belvieu, Tex., increased by 10% from the previous quarter, reaching an average of $8.10/MMbtu. This rise was largely fueled by increases in the prices of ethane and propane.
In late April, China lifted a 125% retaliatory tariff on US ethane imports, which had been imposed earlier that month. With this tariff eliminated, robust growth will continue in US ethane production and exports. According to EIA’s projections, the US will produce 2.9 million b/d of ethane this year and 3.1 million b/d next year, an increase from 2.8 million b/d in 2024.
US refining
US refinery runs increased year over-year during first-quarter 2025, supported by strong consumption of heating fuels due to an unusually cold winter.
Since OPEC+ significantly cut crude production, heavy/sour crude differentials in North America have been relatively narrow, which have adversely affected margin capture.
However, several factors could widen these spreads over the rest of 2025, including increased production from OPEC+, Canadian production ramping up after maintenance, and refining capacity reduction.
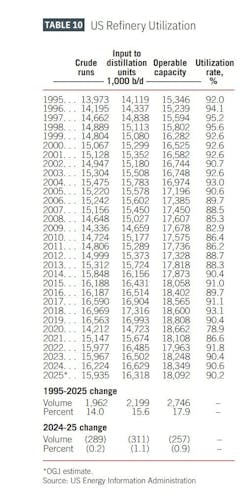
In first-half 2025, gross inputs to US oil refineries are projected to average 16.19 million b/d, reflecting a 1.1% decrease compared with the same timeframe in 2024. Crude oil refinery inputs are anticipated to be slightly lower as well, averaging 15.87 million b/d, a decline of 0.33% from first-half 2024. Refinery utilization is estimated to average 89% during first-half 2025, compared with 89.2% in the previous year.
For the entire year of 2025, refinery utilization is expected to average 90.2%, a modest decline from the 90.6% recorded in 2024. Regionally, the West Coast saw utilization rates fall from 80-90% in January and February to below 75% by late March. This decline was primarily driven by outages at PBF Energy's Torrance and Martinez refineries in California. On the East Coast, utilization began the year at 83% but dropped below 60% in late February and throughout March, ending the quarter at just 59%. This decline was influenced by seasonal spring maintenance and a major turnaround at Phillips 66’s Bayway refinery in Linden, NJ.
Refining margins have experienced considerable pressure in first-quarter 2025. However,
entering the second quarter, refining margins have strengthened significantly, led by improved Los Angeles crack spreads and gasoline margins. Market participants are replenishing gasoline inventories ahead of the summer driving season and restocking diesel supplies depleted by an especially cold winter. Throughput constraints in certain regions may also keep product markets relatively tight, supporting margins.
US refining capacity is estimated to have averaged 18.19 million b/d during first-half 2025, down slightly from 18.36 million b/d over first-half 2024. Full-year 2025 capacity is expected to decrease to 18.09 million b/d from 18.35 million b/d due to announced refinery closures.
Chemical maker LyondellBasell has permanently shuttered its 263,776 b/d Houston refinery in first-quarter 2025. Phillips 66 will shut its large Los Angeles-area oil refinery late in 2025,
citing long-term market uncertainties. This will reduce California’s refining capacity to 1.5 million b/d.
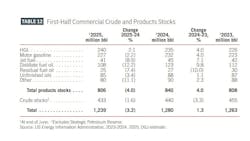
US oil stocks
Since the start of 2025, US commercial crude oil inventories have been consistently below year-ago and 5-year average levels. US commercial crude oil stocks are projected to be about 432 million bbl by the end of June 2025, a decrease from 440 million bbl at the same time last year.
This can be attributed to robust refinery demand, decreased net crude imports, and the replenishment of the Strategic Petroleum Reserve (SPR), all of which have collectively surpassed the modest increase in domestic crude production.
The US SPR has been gradually replenished following significant drawdowns in previous years. The 2025 mid-year volume of SPR crude oil is expected to exceed 400 million bbl, up from 373 million bbl a year earlier. A US House budget proposal seeks over $1.5 billion for SPR replenishment, including $1.32 billion for oil purchases and $218 million for maintenance.
Energy Secretary Chris Wright estimates that refilling the SPR to its maximum capacity will cost $20 billion and take several years.
US gasoline demand and inventories have also remained near last year's levels. Distillate fuel stocks have been around 13% below the 5-year average so far this year, indicating tightening supply. After reaching a 6-year high in August 2024, US jet fuel stocks in 2025 are projected to decrease due to rising consumption and reduced refinery production following US refinery closures.
US natural gas market
In first-half 2025, the average natural gas spot price at Henry Hub reached around $3.80/MMbtu, a notable increase from the $2.11/MMbtu in the same period last year.
The annual spot price declined from $2.54/MMbtu in 2023 to $2.19/MMbtu in 2024 and is expected to rise to $4/MMbtu in 2025.
The North American natural gas market entered 2025 with heightened volatility, driven initially by a powerful polar vortex that swept down from Canada, triggering a sharp spike in residential and commercial heating and electricity demand across the central and eastern US.
This weather event also caused well freeze-offs, constraining supply and leading to a substantial drawdown in gas storage.
As a result, the Henry Hub spot price surged to a seasonal peak of $7.15/MMbtu on Feb. 19. Since then, milder spring weather has had an impact. Demand has remained stable, with increased US LNG exports driving upward demand, countered by a milder spring weather, which reduced residential and commercial demand and kept the electric power sector's demand stable. Further, robust dry natural gas production has helped lower prices and facilitate the replenishment of gas storage. These combined factors brought natural gas inventories back to the 5-year average (2020–2024) by end-April. During March and April, total injections into storage reached 331 bcf, well above the 5-year average of 135 bcf
for the same period.
Looking ahead, the market is bracing for potentially warmer-than-normal summer temperatures. The National Oceanic and Atmospheric Administration (NOAA)’s seasonal outlook favors above-average temperatures across much of the US, likely increasing air conditioning demand and electricity generation, reducing storage injection rates. This,
along with continued strong LNG exports, could tighten the market.
In terms of domestic consumption in the US, structural growth is ongoing, especially fueled by the burgeoning data center sector and the rising demands of AI-driven computing. This trend is leading to increased electricity consumption, which in turn boosts the need for gas-fired power generation.
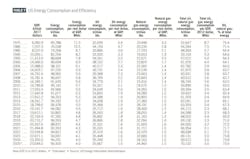
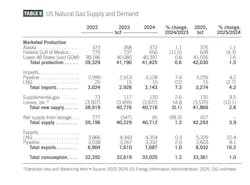
US natural gas consumption averaged 90.5 bcfd in 2024, up 1.2% from a year earlier, according to EIA data. US natural gas consumption in first-half 2025 is estimated to have averaged 93.5 bcfd, up from 91.7 bcfd over the same period a year ago. OGJ forecasts that US annual gas consumption will rise 1% this year, averaging 91.4 bcfd.
On the supply front, the capacity for natural gas pipelines from the Permian basin is expected to expand, allowing producers to increase natural gas deliveries from the region. This enhanced takeaway capacity could elevate prices at the Waha Hub. However, a recent downturn in crude oil prices has tempered expectations for growth in US crude oil production, which may lead to lower associated natural gas production compared with previous forecasts.
The Haynesville region is anticipated to see a rise in production, driven by higher natural gas prices and growing demand from new nearby LNG export projects.
The international demand for US LNG continues to play a vital role. US LNG maintains global competitiveness, providing gas to Europe, supported by reduced Russian pipeline supplies and depleted European storage following a severe winter.
Notably, Canada's LNG Canada terminal is set to begin operations in mid-2025, offering Pacific basin access and reducing its reliance on the US market.
Two US LNG major projects—the Plaquemines LNG plant in Louisiana and the expanded Corpus Christi plant—have significantly increased export levels. Early data from Plaquemines LNG shows production and exports exceeding prior expectations. Two additional projects, Golden Pass and Plaquemines LNG Phase 2, are slated to come online over the next 2 years, further expanding capacity. As a result, US LNG exports are projected to grow significantly—by 22% in 2025 and by an additional 10% in 2026.
Pipeline exports are also expected to grow, with volumes rising 8% in 2025 and 7% in 2026. Taken together, total US natural gas exports are forecast to increase by 3.4 bcfd in 2025 and by 2.1 bcfd in 2026.
About the Author

Conglin Xu
Managing Editor-Economics
Conglin Xu, Managing Editor-Economics, covers worldwide oil and gas market developments and macroeconomic factors, conducts analytical economic and financial research, generates estimates and forecasts, and compiles production and reserves statistics for Oil & Gas Journal. She joined OGJ in 2012 as Senior Economics Editor.
Xu holds a PhD in International Economics from the University of California at Santa Cruz. She was a Short-term Consultant at the World Bank and Summer Intern at the International Monetary Fund.

Laura Bell-Hammer
Statistics Editor
Laura Bell-Hammer is the Statistics Editor for Oil & Gas Journal, where she has led the publication’s global data coverage and analytical reporting for more than three decades. She previously served as OGJ’s Survey Editor and had contributed to Oil & Gas Financial Journal before publication ceased in 2017. Before joining OGJ, she developed her industry foundation at Vintage Petroleum in Tulsa. Laura is a graduate of Oklahoma State University with a Bachelor of Science in Business Administration.