Oil, fundamental analysis
Once again, multiple factors took crude prices on a rollercoaster this week highlighted by the on-again/off-again tariff decisions by US President Trump. A developing trade war with China, a new level of pressure on Iraq, OPEC+ holding firm on returning output next month, and a gain in inventory all added chaos to the market.
WTI hit its High for the week of $70.60/bbl on Monday while falling to a Low of $65.22 Wednesday. Brent crude, in similar fashion, had a High on Monday of $73.65 with a Low Wednesday of $68.35. Both grades settled lower on the week. Meanwhile, the WTI/Brent spread has widened slightly to ($3.20).
Both Canada and Mexico have initiated countermeasures to the Trump tariffs and the financial markets have responded negatively to the impact those will have on the US economy. Trump has now backtracked on the tariffs imposed on Mexico by delaying them until Apr. 2. US refiners already had started reducing purchases of the heavier Mexican crude due to the increased costs.
OPEC+ announced plans to increase output by 138,000 b/d Apr. 1 as the coalition sees an improved demand forecast for this year. Analysts have speculated that the motive lies more in capturing lost market share. Additionally, the Saudis cut April prices for deliveries to Asia, the first such drop in 3 months as the market now sees the unwinding of OPEC+ cuts next month.
Kurdish oil is not flowing despite the easing of political tensions as producers in the region have only been offered $16/bbl by the Iraqi government. Meanwhile, Chinese imports of oil fell 5% last month vs. the same period in 2024. US sanctions on Iranian and Russian crude have been seen as part of the reduction along with economic troubles.
The Energy Information Administration’s (EIA) Weekly Petroleum Status Report indicated commercial crude oil inventories increased while production remained stable. Meanwhile, the US Secretary of Energy will seek up to $2.0 billion in funding for the purchase of oil for the Atrategic Petroleum Reserve (SPR).
The EIA is warning of possible shortages in fuel inventories later in the year as demand grows and two US refineries close. The agency foresees inventory possibly falling to 2000 levels.
Unemployment in February ticked-up to 4.1% as 150,000 jobs were added vs. January but the total was less than the forecasted +170,000 and less than the monthly average gain of 160,000. The impact of the mass firings of federal employees is not yet reflected in these numbers.
All 3 major US stock indexes have rebounded slightly after their precipitous fall this week on the tariff announcement. Fed Chairman Powell commented Friday that the central bank will be watching the economy closely but doesn’t intend to make any moves in the near-term. The USD is also down on the week but has not helped to support oil prices.
Oil, technical analysis
NYMEX WTI Futures are below the 8-, 13-, 20- and 100-day Moving Averages. After a breach of the Lower-Bollinger Band limit, prices have moved back above that “Buy” signal. The downtrend is now 6 weeks old. Volume is about average at 240,000. The Relative Strength Indicator (RSI), a momentum indicator, is “oversold” at the “39” mark. Resistance is now pegged at $67.00 with near-term Support at $66.10, the Lower-Bollinger Band mark.
Looking ahead
For the second week in a row, the many variables in play make future price direction hard to predict. However, even with the current mix of possible supply/demand changes, increasing supply coupled with the perception of weakening consumption seems to dominate market mentality. Responses to technical signals have consistently corrected large price swings as well.
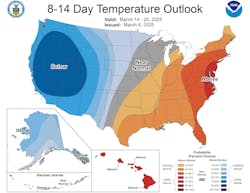
Heating oil demand appears to be weak in the 8-14-day outlook as we move into the spring season. Also, the ever-changing tariff situation is impacting global economies which are directly tied to energy consumption.
Natural gas, fundamental analysis
The rally in natural gas for April slowed-down this week on milder temperatures and a lower-than-forecasted storage withdrawal. Prices, however, remain well-above $4.00/MMbtu for a shoulder month.
A High of $4.55/MMbtu occurred with the week’s Low of $3.74 on Monday. Supply last week was +0.8 bcfd to 111.5 bcfd vs. 110.7 the prior week. Demand was -15 bcfd to 114.9 bcfd vs. 129.9 bcfd the week prior, with the biggest decreases coming in residential and power consumption.
Exports to Mexico were 6.3 bcfd vs. 6.3 bcfd the prior week. LNG exports were 16.1 bcfd vs. 16.3 bcfd the prior week.
The EIA’s Weekly Natural Gas Storage Report indicated a withdrawal of 80 bcf vs. a forecast of -92 bcf. Total gas in storage is now below 2.0 tcf at 1.76 tcf, dropping to 24.9% below last year and 11.3% below the 5-year average.
Natural gas, technical analysis
April 2025 NYMEX Henry Hub Natural Gas futures are above the 8-, 13-, and 20-day Moving Averages. Volume is about the recent average at 210,000. The RSI is still overbought at 64. Support is pegged at $4.15 (8- & 13-day Mas) with Resistance at $4.35 (Friday’s High). Having pierced the Upper-Bollinger Band this week, prices have retreated under that level, which should keep a cap on any future rally.
Looking ahead
Chinese demand for LNG has dipped to its lowest level since February 2020 on warmer weather and declining manufacturing growth. Ireland has approved a plan for an emergency LNG import facility. The FSRU will serve as a strategic gas reserve.
European natural gas prices remain strong and were most recently at $10.50/MMbtu. As with heating oil, the next (8-14) days look bearish for natural gas demand. April futures will receive support from the needed storage injections.
About the Author

Tom Seng
Dr. Tom Seng is an Assistant Professor of Professional Practice in Energy at the Ralph Lowe Energy Institute, Neeley School of Business, Texas Christian University, in Fort Worth, Tex.


