OPEC+ faces escalating pressure in 2024
In 2023, oil demand reached an unprecedented 101.7 million b/d, driven by the rapid expansion of Chinese petrochemical activity and a surge in its demand for NGL feedstocks. This surpasses the pre-pandemic level of 100 million b/d in 2019. However, the pace of oil demand growth is decelerating due to the ongoing deteriorations in the macroeconomic environment. Meantime, as oil demand has gradually rebounded from the lows reached in 2020, demand growth in 2024 will be less robust compared with 2023 and 2022, as the baseline is now higher.
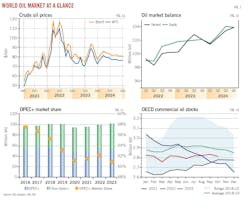
According to data from the International Energy Agency (IEA), a collective supply increase of 1.8 million b/d elevated global supply to its highest-ever level of 101.9 million b/d in 2023. The increase in non-OPEC+ production (+2.2 million b/d) more than offset the decline in OPEC+ production (-400,000 b/d). Global liquid fuel production is expected to continue growing in 2024, but at a moderated pace.
Record-breaking US supply is boosting non-OPEC+ output. Despite the drop in rig count, US crude oil production averaged 12.9 million b/d in 2023, up 1 million b/d from 2022, bolstered by improved operating efficiencies and well productivity.
Record supply levels from the US, Brazil, and Guyana, combined with a notable rise in Iranian oil production and a deceleration in demand growth, weighed on oil prices. In early December 2023, oil prices had declined by about $25/bbl from September’s highs.
Some OPEC+ members announced additional production cuts for first-quarter 2024 to avert a potential inventory buildup. However, a concern in the market is that OPEC+ cannot reach a unified agreement based on collective action and effective implementation. Going forward, the approach of voluntary cuts may start to show signs of fatigue.
OPEC+ is experiencing a decline in market share compared with US shale and other non-OPEC+ production. Engaging in market-share battles, however, could reduce members’ revenues. With slowing demand growth, OPEC+ is encountering escalating pressure in 2024.
US natural gas production is also growing. US marketed gas production is expected to have risen to 113 bcfd in 2023 and to reach 115 bcfd in 2024 from 108 bcfd in 2022. The global LNG market remains tight, and US LNG export growth will accelerate in 2024 and beyond with significant capacity additions.
Global oil demand
IEA anticipates that global oil demand hit 101.7 million b/d in 2023, indicating a growth of 2.3 million b/d compared with the preceding year. China contributed nearly 80% of the global rise for the year, thanks to the country’s surging petrochemical activity and rocketing demand for LPG/ethane.
However, oil demand growth is encountering challenges amid deteriorations in the macroeconomic environment and the diminishing rebound from pandemic-induced lows.
IEA revised down global demand growth for fourth-quarter 2023 by nearly 400,000 b/d, with Europe accounting for more than half of this decline due to record-low industrial demand.
The deceleration of oil demand growth is expected to persist into 2024, with global gains decreasing by half to 1.05 million b/d, according to IEA, as major economies experience slowing GDP growth. Efficiency improvements and a rising electric vehicle fleet also impede oil demand.
According to the October 2023 World Economic Outlook by the International Monetary Fund (IMF), global economic growth of 2.9% is projected for 2024, a decrease from 3% in 2023 and 3.5% in 2022. Specifically, due to a deepening crisis in the property sector and weakening confidence, China’s economic growth is anticipated to drop to 4.2% in 2024 from 5% in 2023.
Following a rise of 75,000 b/d in 2023, total oil consumption in the OECD region is projected to decrease by 270,000 b/d in 2024, with an average of 45.5 million b/d. As per the IMF, the overall economic growth of the advanced economies is anticipated to decline to 1.4% in 2024 from 1.5% in 2023 and 2.6% in 2022 amid stronger-than-expected momentum in the US and weaker-than-expected growth in the Euro area.
In the OECD Americas, oil demand is expected to contract by 165,000 b/d in 2024, following a 220,000 b/d expansion in 2023. The US recorded a noteworthy average gain in 2023, showcasing the resilience of economic activity and oil consumption despite unprecedented interest rate hikes. However, with a cooling job market, the IMF expects a growth rate of 1.5% for the US economy in 2024, a decrease from the 2.1% recorded in 2023. With successful measures in curbing inflation, the Federal Reserve foresees interest rate cuts in 2024 and a soft economic landing is in view.
Due to a deep economic downturn and weak industrial activity, OECD Europe’s oil demand declined to 13.35 million b/d in 2023 from 13.5 million b/d in 2022 and is set to decline to 13.3 million b/d in 2024. Germany’s GDP contracted by 0.5% in 2023, per IMF, and its oil consumption posted the largest decline around the world during the year. Gasoil and naphtha accounted for the bulk of the decrease.
However, some recent economic indicators, including PMI and bank lending, suggest the slump may be bottoming out. The inflation rate target is also approaching. The IMF forecasts Euro area’s growth will rebound to 1.2% in 2024 from a low of 0.7% in 2023, while some other institutions still predict a lackluster 2024.
Demand in OECD Asia will decline by 25,000 b/d in 2024 from a year ago. The IMF forecasts a 1% growth in Japan, down from 2% in 2023.
Non-OECD oil demand is expected to rise by 1.28 million b/d this year, following a 2.2 million b/d growth in 2023, according to IEA. Growth in the emerging market and developing economy group is expected to be 4% in 2024, same as in 2023, according to the IMF.
In 2023, Chinese oil demand was estimated at 16.45 million b/d, an increase of 12.3% (+1.8 million b/d) from 2022 and about 2.7 million b/d above the 2019 level. Rapid expansion of China’s petrochemical sector, coupled with increased road fuel usage as restrictions eased and the resurgence of international air travel contributed to gains in 2023. Economic growth in China is projected to decline to 4.2% in 2024 from 5% in 2023 due to deepening crisis in the property sector. IEA expects an expansion of 710,000 b/d for China in 2024.
India oil demand is expected to average 5.63 million b/d this year, an expansion of 135,000 b/d over 2023, partly reflecting recent strong passenger vehicle sales. Indian economic growth is forecast to stay at 6.3% in 2024.
From a product perspective, demand for naphtha, LPG, and ethane will maintain strong growth momentum in 2024, accounting for 70% of total demand growth.
Global gasoline demand increased to over 26.9 million b/d in 2023, marking a significant increase of 700,000 b/d compared with the previous year. Gasoline market fundamentals are expected to weaken in 2024 due to anticipated increased refinery capacity.
Jet fuel demand surged by 17% in 2023 to 7.2 million b/d. However, this figure remained below the pre-pandemic 2019 level of 7.9 million b/d. The recovery of international travel in China played a significant role in this surge, especially following the removal of the health declaration requirement for all travelers. Furthermore, the relaxation of flight limits between the US and China is expected to boost traffic and jet fuel demand.
Global diesel demand growth is expected to remain stagnant in 2024, especially given a slower demand growth in China. While crude supplies are likely to continue to constrain European output, higher throughput elsewhere will contribute to stronger supply growth, putting pressure on the market.
Global throughput is projected to rise by 1 million b/d in 2024 after rising by 1.6 million b/d in 2023, driven by new and recently started refining capacity in Africa, the Middle East, and Asia. Given slower demand growth for refined products, increased refined product supply will exert pressure on utilization rates and margins in 2024.
Global oil supply
World oil production averaged 101.9 million b/d in 2023, up 1.8 million b/d from a year earlier, as the increase in non-OPEC+ supply (+2.2 million b/d) more than offset the decline in OPEC+ supply (-400,000 b/d).
Aiming to prevent a significant increase in inventories resulting from higher non-OPEC+ output and support oil prices, OPEC+ members announced additional voluntary oil supply cuts for first-quarter 2024, amounting to 2.2 million b/d. This reduction is led by Saudi Arabia extending its substantial existing cut of 1 million b/d. Russia has extended and deepened its export curbs, and other OPEC+ producers have committed to an additional combined reduction of 700,000 b/d.
However, the voluntary reductions are expected to translate into an actual extra cut of about 500,000 b/d compared with fourth-quarter 2023. While the reductions may be sufficient to maintain a slight deficit in world oil markets at the beginning of 2024, reaching an agreement on the cuts involved challenging deliberations. In an unusual move, participants individually announced their volumes.
Saudi Arabia continues to shoulder the bulk of OPEC+ production cuts. Since July 2023, the country has maintained its supply at about 9 million b/d, a level to be upheld through first-quarter 2024.
Despite US sanctions, Iran’s crude oil supply has been rapidly increasing, reaching 3.19 million b/d in November 2023, the highest level since October 2018. Official talks to revive the 2015 Iran nuclear deal, potentially easing sanctions, have been on hold for over a year. Tehran has expressed a goal of achieving crude production of 3.6 million b/d by March 2024 on an estimated capacity of 3.8 million b/d.
Production data shows that underinvestment, operational challenges, and sabotage have kept supply of some OPEC+ countries, such as Nigeria and Angola, well below the assigned quotas. In contrast, the UAE, Iraq, Kazakhstan, and Russia have consistently recorded production above quotas.
Russia’s production declined to 10.93 million b/d in 2023 from 11.07 million b/d in 2022. Russia’s oil production in 2024 is forecast to fall 1.1% to 10.8 million b/d. According to preliminary estimates, Russian seaborne crude oil exports averaged 4.9 million b/d in 2023, compared with 5 million b/d in 2022 and 4.6 million b/d in 2021; product exports averaged 2.52 million b/d in 2023, compared with 2.5 million b/d in 2022 and 2.6 million b/d in 2021; total export revenue totaled $15 billion in 2023, down from $19.5 billion in 2022 and $15.7 billion in 2021.
Unprecedented US supply is driving non-OPEC+ output expansion of $2.2 million b/d in 2023. Significant contributions also came from Brazil and Guyana, both achieving record-high production levels. These three countries combined made up 86% of the growth in non-OPEC+ supply for 2023. In 2024, these three countries are poised for new records, elevating non-OPEC+ production to a new high of 51.5 million b/d.
Production from the US rose to 19.3 million b/d in 2023 from 18.01 million b/d in 2022, defying expectations. The US’s oil production in 2024 is forecast to expand 1.6% to 19.6 million b/d. Despite a decline in oil rigs, US crude output continues to increase, attributed to longer laterals and more intensive completions that have enhanced production-per-rig metrics.
Brazil’s total oil production was up to a record 3.5 million b/d in 2023 from 3.12 million b/d in 2022, an increase of 12.18%. The country’s production is expected to climb to 3.79 million b/d in 2024, up 8.29%. Six new FPSO vessels are progressively increasing production levels and maintaining high operational efficiency. Two additional vessels, Mero 2 and Mero 3, are anticipated. Both have a capacity of 180,000 b/d. Brazil may join OPEC+ in 2024, bringing the group’s number of countries to 24, but it may not participate in the group’s supply cuts.
Canada’s production dropped slightly in 2023 to 5.75 million b/d from 5.76 million b/d in 2022. The country’s production is expected to grow to 5.79 million b/d this year, up 1%. Outbound capacity constraints for Alberta producers will be eased with the launch of the Trans Mountain Expansion (TMX) in second-quarter 2024. The 590,000 b/d pipeline to Canada’s west coast can alleviate transportation constraints and spur production growth. It also suggests that the price discount for Western Canadian crude oil will decrease significantly in the coming years.
Norway’s total oil production increased 4.2% to 1.99 million b/d in 2023 from 1.91 million b/d in 2022. The country’s production is expected to climb to 2.04 million b/d in 2024.
OECD oil stocks
At the end of October 2023, OECD industry inventories reached 2,812 million bbl, narrowing the deficit versus the 5-year average of 2018-2022 to 72 million bbl from a peak of 317 million bbl in May 2022.
Oil inventories will fall or remain stable in first-quarter 2024 in light of further OPEC+ production cuts. If the 2.2 million b/d in voluntary production cuts announced by OPEC+ are phased out in 2024, the market will see inventories build rapidly. If OPEC+ sticks to production cuts throughout 2024, we will likely see a balanced market or even a deficit oil market.
US oil demand
According to latest data from the US Energy Information Administration (EIA), US oil demand in 2023 was 20.15 million b/d, up from 20 million b/d in 2022. Gasoline and jet fuel were the main drivers of 2023 total US oil consumption, with both up about 90,000 b/d year-over-year (y-o-y).
OGJ forecasts that total US oil demand will average 20.35 million b/d in 2024, an increase of 200,000 b/d (1.02%) from the 2023 level. The projected increase in consumption of jet fuel and hydrocarbon gas liquids (HGL) will be the main contributor to this growth.
Demand for motor gasoline increased by an estimated 90,000 b/d (+1%) in 2023 to 8.88 million b/d. Vehicle miles traveled (VMT) during the first 10 months of 2023 rose 2.2% compared with the same period a year ago, as reported by the US Federal Highway Administration. EIA expects US regular gasoline retail prices to average $3.53/gal in 2023, compared with $3.97/gal in 2022. In 2024, retail gasoline prices are projected to be $3.40/gal.
OGJ forecasts that demand for motor gasoline will edge down 0.7% in 2024, weighed down by a cooling job market, the continued work-from-home environment, car efficiency gains, and the expansion of the electric vehicle fleet.
Estimated US HGL consumption averaged 3.4 million b/d in 2023, compared with 3.36 million b/d in 2022. OGJ expects this consumption to increase by 169,000 b/d (5%) in 2024 due to its use as a feedstock for petrochemical production.
US consumption of distillate fuel oil for 2023 is estimated to have averaged 3.94 million b/d, 2.1% lower than a year ago. According to data from US Bureau of Transportation Statistics, trucking freight year-to-date, as measured by the truck tonnage index, indicates a decrease of nearly 2% in 2023. OGJ expects that distillate fuel oil demand will increase by 40,000 b/d (1.1%) in 2024, as a soft economic landing becomes increasingly likely.
Demand for jet fuel averaged 1.65 million b/d in 2023, up 6% from a year ago. Notably, jet fuel consumption returned to pre-pandemic 2019 levels for the first time in September 2023. The International Air Transport Association (IATA) reported growth of nearly 16% in US revenue passenger miles (RPM) during the first 9 months of 2023 compared with the corresponding period the previous year. Looking ahead, OGJ forecasts a 6% growth in jet fuel demand for the year 2024.
US oil production
US crude oil production averaged 12.9 million b/d in 2023, up 1 million b/d from 2022, according to data from EIA. The increase defied expectations and was supported by improved drilling efficiencies and well productivity in the shale patch, which offset the impact of a declining rig count. OGJ anticipates that US crude oil production will reach a record of 13.2 million b/d in 2024.
According to the rig count report released by Baker Hughes, the number of active US oil rigs was 501 for the week ended Dec. 15, 2023, compared with 620 active oil rigs for the same time in 2022.
Despite the decline in active drilling rigs since early 2023, US crude oil production has reached a historic high. This is primarily due to completion of DUC (drilled but uncompleted) wells and higher productivity for new wells.
One indicator for assessing the production potential of oil wells is the average daily crude oil production in the first month for new wells. The data from oil fields shows a continuous increase in new well production per rig, indicating a steady rise in production efficiency.
Meantime, less drilling came with more completions. US inventory of DUC wells fell to 4,524 in October 2023 from 5,325 in December 2022, a drop of 15%, according to EIA’s Drilling Productivity Report.
Notably, according to EIA’s analysis of cash flow data from 40 US exploration and production companies, starting from second-quarter 2023, there has been a rise in the allocation of operating cash flow by these companies towards capital expenditures and merger and acquisition funds. This uptick in capital expenditure is expected to lead to the expansion of new drilling operations, resulting in a subsequent boost in crude oil production. Preliminary 2024 guidance also show that publicly traded companies are becoming less sensitive to higher prices.
Survey data from the Federal Reserve Bank of Dallas shows a breakeven oil price for new shale oil wells of $56-66/bbl, while the shut-in oil price for existing wells ranges is $29-40/bbl. Given the expectation that the oil price equilibrium will remain stable at a moderately high level in the coming years, shale oil extraction remains economically viable.
Crude oil production from the Permian region surged to 5.9 million b/d in 2023 from 5.38 million b/d in 2022 and 4.7 million b/d in 2021. Rig counts dropped to 311 at end-October from 355 at the start of 2023. New well oil production per rig grew nearly 20% over the course of the year.
Crude oil production from the Bakken region grew to 1.21 million b/d in 2023 from 1.1 million b/d in 2022. Production per rig increased 13% over the course of 2023. Eagle Ford crude production increased to 1.16 million b/d in 2023 from 1.1 million b/d in 2022. New well oil production per rig increased 37% over the year.
In 2024, with depleting inventory and stabilized operating metrics, US shale patch production growth is expected to slow.
The Gulf of Mexico is expected to see crude production increase in 2024, driven by new projects coming online. In 2023, production from the Gulf of Mexico averaged 1.88 million b/d, up 8.5% from a year ago.
US NGL production grew 7.9% in 2023 to 6.4 million b/d, reaching a record high. NGL production is set to increase 2% to 6.52 million b/d in 2024, OGJ forecasts. Combined, US total domestic oil production in 2024 is expected to rise 2% from a year ago to 19.67 million b/d.
US refining
Gross inputs to US refineries, or refinery runs, averaged 16.4 million b/d in 2023, down from 16.48 million b/d in the previous year. US refiners ran at an average utilization rate of 89.9% in 2023, compared with 91.8% in 2022, reflecting increased US refining capacity.
US refining capacity increased slightly for the first time since the COVID-19 pandemic, reversing 2 years of decline, according to EIA’s annual Refinery Capacity Report. US refining capacity averaged 18.25 million b/d during 2023, compared with 17.96 million b/d for 2022. ExxonMobil began operations from its Beaumont refinery expansion in March 2023, boosting the refinery’s capacity by 250,000 b/d to 630,000 b/d.
Refining cash margins for the first 10 months of 2023, the latest data available, averaged $26.29/bbl for the Midwest, $27.12/bbl for the West Coast, $25.04/bbl for the Gulf Coast, and $16.34/bbl for the East Coast, according to Muse Stancil & Co. These compared with cash refining margins of $34.51/bbl, $30.78/bbl, $28.72/bbl, and $22.34/bbl, respectively in 2022. For the same period in 2021, these refining margins averaged $15.78/bbl, $12.89/bbl, $8.20/bbl, and $6.62/bbl.
US refining margins are expected to remain relatively robust given resilient demand. Nevertheless, the introduction of global capacity in 2024 might gradually ease product balances. Sanctions on Russia have not significantly impacted the supply of products. For US refiners, the completion of Trans Mountain (TMX) and capacity adds in the Gulf of Mexico and Atlantic Basin could also tighten crude differentials and weaken margins.
US oil trade
According to EIA data, in the first 9 months of 2023, the US exported an average of 4 million b/d of crude oil, an increase of 561,000 b/d (16.3%) from the same period in 2022, and a record high for a year since 2015.
Europe was the largest regional destination for US crude oil exports by volume. Asia was the second-largest regional destination. The top country destination for US crude oil exports was the Netherlands, followed by China and South Korea. In the first 9 months of 2023, US crude oil exports to the Netherlands averaged 619,000 b/d, up 85.2% over the same period in 2022.
US crude exports to China averaged 476,000 b/d in the first three quarters of 2023, up from 198,000 b/d over the same period in 2022. US crude exports to India averaged 181,000 b/d in the first three quarters, down from 273,000 b/d for the same period a year ago.
Despite a surge in crude exports in 2023, the US still imported more crude oil than it exported. During the first three quarters of 2023, the US imported 6.47 million b/d of crude oil, compared with 6.32 million b/d for the same period a year ago. Crude oil imports from OPEC members averaged 1.08 million b/d, compared with 970,000 b/d in the first three quarters of 2022. However, US’s crude imports from Saudi Arabia for this year’s first three quarters dropped to 384,000 b/d from 457,000 b/d for the same period a year ago. The leading source of US crude imports was Canada, which supplied 3.84 million b/d over the period.
The US exported about 6 million b/d of petroleum products in the first three quarters of 2023, a growth of 0.48% from the same period in 2022. Mexico received the largest share of US petroleum products exports at 1.15 million b/d, followed by Japan at 564,000 b/d, and China at 517,900 b/d.
The US exported 2.59 million b/d of HGL in the first three quarters of 2023, compared with 2.39 million b/d over the same period a year ago. Japan received the largest share of US HGL exports at 502,000 b/d, followed by China at 439,000 b/d, and Mexico at 188,000 b/d.
In the first 9 months of 2023, the US exported an average of 1.53 million b/d of propane, an increase of 136,330 b/d (9.78%) compared with the same period in 2022. Japan was the major destination for US propane exports, accounting for nearly 30% of total US propane exports. US propane also went to China, Korea, and Mexico.
The US exported 1.08 million b/d of distillate in the first three quarters of 2023, down from 1.2 million b/d over the same period a year ago. The top destination for US distillate exports was Mexico. Over the first 9 months of 2023, US distillate exports to Mexico averaged 296,000 b/d, up 3.65% over the same period in 2022. Aside from Mexico, US distillate exports went mostly to Chile, Panama, and Peru.
Despite lower total distillate exports, US distillate exports to Europe increased in 2023 compared with 2022, following the EU’s complete import bans on Russia’s petroleum products from the beginning of 2023.
The US exported 789,000 b/d of motor gasoline in the first three quarters of 2023, compared with 847,000 b/d over the same period a year ago. Mexico received the largest share of US motor gasoline exports at 452,000 b/d.
During 2023’s first three quarters, the US imported 2.1 million b/d of petroleum products, compared with 2.06 million b/d for the same period a year ago.
Oil stocks
During 2023, higher domestic crude oil production resulted in higher crude oil stocks versus a year ago. US crude oil inventories excluding the Strategic Petroleum Reserve (SPR) closed out 2023 at 435 million bbl, compared with 430 million bbl from a year ago. The amount of crude oil in the SPR stood at 355 million bbl at end-2023, compared with 372 million bbl at yearend 2022, and $594 million bbl at yearend 2021.
Meantime, as refiners ramped up output, total product stocks at the end of 2023 were also up from the year-ago levels. Total petroleum product stocks stood at 811 million bbl at yearend 2023, up from 792 million bbl at yearend 2022. Motor gasoline inventories finished 2023 at 236 million bbl, compared with 224 million bbl at yearend 2022. Distillate fuel oil stocks moved to 120.2 million bbl from 119 million bbl at end-2022, and inventories of jet fuel oil finished 2023 at 36.5 million bbl, up from 35 million bbl a year ago.
US natural gas market
Natural gas spot prices at Henry Hub averaged $6.42/MMbtu in 2022. Although Henry Hub spot prices declined from their August 2022 peak, they remained relatively high through the end of the year, consistently exceeding $6/MMbtu. However, by January 2023, Henry Hub spot prices fell below $4/MMbtu and continued to decline throughout the year. The average from January to November was around $2.56/MMbtu. In 2024, Henry Hub spot prices are expected to remain below $3/MMbtu as mild weather, high storage, and strong production offset impacts from an acceleration in LNG exports and increased pipeline exports to Mexico.
Estimated US consumption of natural gas averaged 89.5 bcfd in 2023, up 1.2% from a year earlier, according to the latest EIA data. Natural gas consumed by the power generation sector in 2023 increased by 6.6% y-o-y to 35.38 bcfd, accounting for nearly 40% of total domestic gas consumption.
The National Oceanic and Atmospheric Administration (NOAA) predicts that overall US heating degree days will be 1.13% less during the 2024-2023 heating season compared with the 2023-2022 heating season.
Industrial natural gas consumption averaged 23.36 bcfd in 2023, 0.1% lower than the 2022 level and accounting for about 26% of total US gas consumption.
The residential and commercial gas consumptions in 2033 dropped 7.6% and 4.3%, respectively compared with their 2022 levels. Combined, these two types of consumption accounted for 24.5% of total US gas consumption.
US natural gas consumption in 2024 is expected to remain stable from a year ago, averaging 89.6 bcfd, OGJ forecasts. Demand from power generators remains strong and should be supported by its discount to coal fuel parity.
Baker Hughes reported 119 natural gas-directed rigs were active in the US as of Dec. 15, a decrease of 37 rigs since the start of 2023. The decline in active drilling rigs coincided with lower natural gas prices for most of 2023, compared with high natural gas prices in 2022.
Despite the rig count decline, US natural gas production increased in 2023. US marketed gas production and dry gas production averaged 112.94 bcfd and 103.67 bcfd, respectively, in 2023. These represent increases of 4.6% and 4.1%, respectively, from year-ago levels.
US marketed natural gas production in the lower 48 states will continue to grow in 2024. Most of the forecast growth comes from the Permian region, where improved well-level productivity and supportive crude oil prices spur oil production that increase associated natural gas production. Estimated Permian gas production increased to 23.84 bcfd in 2023 from 21.23 bcfd in 2022, an increase of 12.3%, according to EIA’s Drilling Productivity Report. OGJ forecasts Permian region natural gas production will increase 6% in 2024.
EIA’s analysis shows average first month production for Permian region wells has risen in recent years, averaging 1,829 MMcf in 2022 compared with 1,301 MMcf in 2017. Permian region wells that started operations in 2023 have produced on average 1,849 MMcf of natural gas during their first full month of operations.
Natural gas production in the Appalachia region, namely the Marcellus and Utica shale plays, increased 3.18% to 35.65 bcfd in 2023 from 34.55 bcfd in 2022. In 2023, estimated gas production in the Haynesville shale increased by 1.3 bcfd, or 8.4%, to 16.76 bcfd, according to EIA’s Drilling Productivity Report.
Marketed natural gas production in the Gulf of Mexico averaged 2.04 bcfd in 2023, accounting for 1.8% of total US production. This compared with 2.11 bcfd in 2022. Gas production in the federal Gulf of Mexico is expected to decrease further in 2024.
US net natural gas exports averaged 12.96 bcfd in 2023, up 21.73% from 10.63 bcfd a year ago and was equivalent to 12.48% of total US dry gas production.
In 2023, US LNG exports increased y-o-y by 1.2 bcfd (+11.5%) to 12 bcfd. Five US LNG export projects are currently under construction with a combined 9.7 bcfd of LNG export capacity (Golden Pass, Plaquemines, Corpus Christi Stage III, Rio Grande, and Port Arthur). ExxonMobil expects the Golden Pass LNG plant to start producing LNG in first-half 2025, a delay from an earlier expectation of late 2024. Venture Global LNG expects Plaquemines LNG to start in late 2024.
OGJ forecasts US LNG exports to increase to 12.5 bcfd in 2024. The ongoing replacement of Russia’s natural gas exports by pipeline to Europe with LNG supports higher US LNG exports. Meantime, the anticipated limited growth in worldwide LNG export capacity within the next 2 years is set to boost demand for destination-flexible LNG supplies, mainly from the US.
Natural gas demand in Mexico continues to grow as a result of electrical generation capacity additions. Mexico’s electric power sector consumption of gas has grown by an average of 3% every year since 2018, according to Wood Mackenzie. Mexico’s domestic gas production growth was stagnant in 2023. These factors resulted in increased pipeline imports from the US, facilitated by a new and expanded pipeline network.
During the first 9 months of 2023, Mexico imported 6.14 bcfd of US natural gas by pipeline, compared with an average 5.7 bcfd for all of 2022. US natural gas pipeline exports to Mexico averaged a record 6.8 bcfd in June 2023.
At the end of the 2023 injection season, working natural gas storage in the lower 48 states reached 3,800 bcf, EIA data showed. This figure was 5% higher than the 5-year average (2018-22) and 7% higher than last Oct. 31. Consequently, the lower 48 states entered the winter heating season with natural gas inventories at their highest levels since 2020. The substantial volume of natural gas in storage was attributed to a mild 2022-23 heating season and relatively full inventories at the start of the 2023 injection season. Natural gas storage will likely remain above the 5-year average throughout winter and for all of 2024.
About the Author

Conglin Xu
Managing Editor-Economics
Conglin Xu, Managing Editor-Economics, covers worldwide oil and gas market developments and macroeconomic factors, conducts analytical economic and financial research, generates estimates and forecasts, and compiles production and reserves statistics for Oil & Gas Journal. She joined OGJ in 2012 as Senior Economics Editor.
Xu holds a PhD in International Economics from the University of California at Santa Cruz. She was a Short-term Consultant at the World Bank and Summer Intern at the International Monetary Fund.

Laura Bell-Hammer
Statistics Editor
Laura Bell-Hammer is the Statistics Editor for Oil & Gas Journal, where she has led the publication’s global data coverage and analytical reporting for more than three decades. She previously served as OGJ’s Survey Editor and had contributed to Oil & Gas Financial Journal before publication ceased in 2017. Before joining OGJ, she developed her industry foundation at Vintage Petroleum in Tulsa. Laura is a graduate of Oklahoma State University with a Bachelor of Science in Business Administration.