Oil market to tighten in 2023
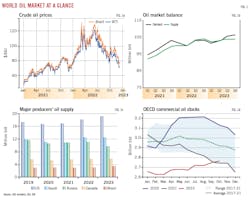
The outlook for global economic growth has deteriorated amid high inflation, falling confidence, and tighter monetary policy. Oil prices already weakened as we approached the end of 2022. Macroeconomic headwinds lead to concerns about oil demand. However, the oil market is expected to tighten in 2023 following the EU ban on Russian crude and products and OPEC+ production cuts, as the US is not there to fill the gap.
Global oil demand growth is projected to decline to 1.5 million b/d in 2023 from 2.3 million b/d in 2022. While the forecast for year-on-year (y-o-y) contraction remains unchanged, global demand growth in 2023 is likely to find some support from a recovery in China’s oil demand and jet fuel demand.
World oil supply growth is projected at 4.5 million b/d in 2022 but below 1 million b/d in 2023. Production in Russia is expected to fall by 1.4 million b/d as more buyers are expected to shy away from Russian supplies with the EU embargo and the G7 price cap. OPEC+’s decision to cut official production targets and dim prospects for the return of Iranian oil limit global supply growth prospects for 2023. Non-OPEC+ output is expected to rise by 1.8 million b/d for 2023, primarily led by the US.
Product markets continue to be tight. Persistently low inventories, particularly those of middle distillates, strike actions and heavy maintenance in Europe, global capacity constraints, and the EU ban on Russian imports will continue to provide strong support to elevated margins.
Meantime, oil inventory replenishment is gaining momentum, but progress remains slow. Global observed inventories continue to hover around their lowest levels. OGJ expects them to remain near the bottom of the 5-year range through 2023. Therefore, any unplanned supply disruption has the potential to send oil prices sharply higher.
Global economy
The war in Ukraine pushed up global energy and food commodity prices. Higher energy and food prices have helped trigger price increases for other goods and services. Central banks around the world are raising interest rates to curb inflation and anchor inflation expectations. The strategy is starting to pay off. However, high interest rates increase financial distress.
According to an OECD economic outlook, world growth will decline to 2.2% in 2023 and bounce back to a relatively modest 2.7% in 2024. The US and European economies are slowing sharply, and the major Asian emerging-market economies are expected to account for close to three-quarters of global GDP growth in 2023.
In a recent research report, Morgan Stanley sees global GDP growth of 2.2% in 2023, barely recession-proof, and below the 3% growth rate in 2022. Global inflation might peak in fourth-quarter 2022, and factors such as slowing demand, rising inventories, and falling house prices could help keep inflation in check, prompting major central banks to pause and review their recent rate hikes, according to the report.
Morgan Stanley expects US economy will tread water with 0.5% growth in 2023. The US economy shows signs of cooling. The Institute for Supply Management’s manufacturing Purchasing Managers Index (TPMI) had a reading of 49 in November of 2022, down from 50.2 in October. The University of Michigan’s consumer sentiment index showed a reading of 56.8 in November, down from 59.9 in October. The survey noted that consumers have expressed continued concern over inflation.
Morgan Stanley expects the euro area economy to contract 0.2% in 2023 on the back of the ongoing energy crisis and tightening monetary policy. Inflation—which surged to an unprecedented annual rate of 10.7% in October 2022—is expected to remain well above target in 2023. The UK economy, which grew 7.5% and estimated 4.2% in 2021 and 2022 respectively, is slated to decline 1.5% in 2023, largely because of its double-digit inflation.
The outlook for the year ahead in Asia is relatively positive. In China, recovering private consumption could lead the economy to a modest recovery for 2023. Morgan Stanley is forecasting 5.4% growth in 2023, with most of that coming in the second half of the year, when the economy is expected to fully reopen. This represents a significant improvement on its forecast of 3.2% growth for China in 2022, which is a sharp decline relative to average growth over the last decade. Separately, Reuters reported that China is working on a stimulus package worth more than $143 billion to support its semiconductor industry, which would be one of the largest fiscal stimulus packages ever undertaken by the country. Meantime, India’s economy is on track to expand 6.2% in 2023, after growing 6.8% in 2022.
Global oil demand
According to the latest estimates from the International Energy Agency (IEA), global oil demand grew by 2.3 million b/d y-o-y in 2022 to reach 99.9 million b/d. Oil demand in 2022 rose by 1.3 million b/d in OECD countries and 1 million b/d in non-OECD countries.
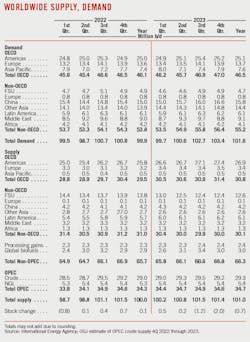
Total OECD demand is expected to rise by 400,000 b/d in 2023, averaging 46.5 million b/d. Demand growth in OECD Americas will slow to 130,000 b/d, following a 680,000 b/d expansion in 2022. OECD European oil demand will increase only 100,000 b/d to 13.74 million b/d. Demand in Asia Oceania will increase by 170,000 b/d to 7.61 million b/d from a year ago. Total OECD demand in 2023 will remain 1.2 million b/d below the 2019 level.
US oil demand will be tepid in 2023 as growth across most major products stagnates. The exceptions are jet fuel, LPG, and ethane.
According to IEA’s forecasts, non-OECD oil demand will increase by 1.4 million b/d in 2023, following a 1 million b/d growth in 2022. On an annual basis, non-OECD oil demand in 2023 will reach 55.2 million b/d, above the 2019 level of 52.9 million b/d.
After decreasing by 420,000 b/d in 2022 under massive lockdowns, China’s oil demand is expected to grow around 820,000 b/d in 2023 to 15.8 million b/d. Beijing has begun rolling back some of its strictest zero-Covid measures in the face of escalating social unrest, weak macro data, and the ongoing property slump.
Indian oil demand increased by 380,000 b/d (+8%) in 2022 to 5.15 million b/d and is expected to increase by 190,000 b/d in 2023 to 5.34 million b/d. Oil use in India has been growing faster than in any other country in recent quarters as US and China’s oil demand slowed down over the period.
By product category, jet/kerosene demand will be the main driver of growth in 2023, IEA forecasts. Jet/kerosene demand is forecast to grow by 13% to 6.84 million bpd in 2023, compared with a 16.8% rise in 2022. However, jet/kerosene demand in 2023 will remain well below the 2019 level of 7.93 million b/d.
Distillate demand, averaging 2.85 million b/d in 2022, has returned to the 2019 baseline and is expected to grow slightly by 0.4% in 2023. Motor gasoline will grow by 0.6% in 2023 to an average of 26.12 million b/d, a slight gap from 26.64 million b/d in 2019.
LPG, ethane, and naphtha will continue their growth trend in 2023 thanks to petrochemical start-ups around the world. However, petrochemical operators are grappling with high energy costs, thinner margins, and slowing downstream demand. Dramatically increased Chinese capacity and new US ethane-based plants are putting pressure on higher-cost producers in Europe and East Asia.
Global oil supply
Throughout 2022, global oil supply is estimated to have increased by 4.7 million b/d y-o-y to 100 million b/d, according to IEA. OPEC+ contributed about 3 million b/d of production growth, led by Saudi Arabia’s 1.6 million b/d increase in annual production, breaking its annual output record set in 2018. To help support oil prices, on Oct.5, 2022, the OPEC+ alliance agreed to cut oil output targets by as much as 2 million b/d.

World oil production is expected to increase by only 800,000 b/d y-o-y to 100.8 million b/d in 2023. Non-OPEC+ production is expected to rise by 1.9 million b/d, led by the US (1 million b/d), followed by Brazil (300,000 b/d) and Norway (270,000 b/d). If maintained through 2023, the OPEC+ decision to cut official production targets would slow its growth outside Russia to just 340,000 b/d.
Saudi Arabia’s crude oil production was estimated to have averaged 10.56 million b/d in 2022. Saudi Aramco reported that its third-quarter 2022 net income climbed 39% to $42.4 billion versus the same period a year ago. In 2023, if Saudi Arabia pumps at its quota through the year, its oil production will average right around its 2022 annual record high.
Russia was expected to smash production records in 2022 before its invasion of Ukraine. Now, it is projected to post an annual growth of just 180,000 b/d. The EU ban on Russian oil imports and a G7 price cap on Russian seaborne crude exports at $60/bbl came into effect on Dec. 5. In 2023, as more buyers are expected to shun Russian supplies amid EU sanctions and the G7 price cap, output from the country will fall by around 1.4 million b/d.
Nevertheless, Russian oil exports have remained resilient to sanctions and boycotts so far. In November 2022, Russia’s total oil exports rose by 270,000 b/d to 8.1 million b/d, the highest level since April 2022, and diesel exports rose by 300,000 b/d to 1.1 million b/d. In November 2022, Russian crude oil loadings in India reached a new high of 1.3 million b/d. However, export earnings fell due to deeper discounts on Russian products.
Regarding the G7 price cap, Russia warned that the cap could lead to market chaos and price increases and said it would not sell under its terms. There are also warnings in the market that the G7 will need support from other major buyers such as China and India if the cap is to take effect.
The United Arab Emirates (UAE)’s crude oil production in 2022 is estimated at 3.28 million b/d, up from 2.76 million b/d in 2021. Abu Dhabi National Oil Co. (ADNOC) has announced that the UAE’s oil and gas reserves increased by 2 billion bbl and 1 tcf, respectively, raising its reserves base to 113 billion bbl of oil and 290 tcf of gas. The company plans to accelerate its capacity expansion, aiming to reach 5 million b/d in 2027 to take advantage of the increase in reserves. It will increase capital expenditure to $150 billion in 2023-27 from $127 billion in 2022-26.
For other OPEC+ producers such as Nigeria, Angola, and Malaysia, operational issues and capacity constraints continue to keep production well under their respective targets. Meanwhile, negotiations to restart the 2015 Iran nuclear deal have been deadlocked since September 2022.
Total US oil production is forecast to rise by 1.15 million b/d in 2022 to an average of 17.8 million b/d. In 2023, US production is expected to increase by 1 million b/d to 18.9 million b/d.
Canadian oil supply is estimated to have increased 2.8% in 2022 to 5.75 million b/d, supported by higher oil prices and new takeaway capacity. Canadian oil production in 2023 is expected to be 110,000 b/d higher than 2022, as offshore Terra Nova field restarts in first-quarter 2023 and oil sands production ramps up with expansion and debottlenecking projects.
Brazil’s oil production increased to 3.14 million b/d in 2022 from 3 million b/d in 2021. Annual production could increase to 3.4 million b/d in 2023 when five additional floating production storage and offloading units (FPSOs) will come online. Petrobras has released its new budget that expects to spend an additional $7 billion ($64 billion in total) on upstream over the next 5 years, with $13 billion earmarked in 2023. This spend will result in 18 new FPSOs by 2027.
Guyana, providing 160,000 b/d of growth in 2022, is expected to add another 100,000 b/d in 2023.
Norway’s total oil production was down from 2.04 million b/d in 2022 to 1.9 million b/d in 2022, due to strikes, heavy maintenance, and unplanned outages. The country’s production is expected to rise to 2.2 million b/d in 2022 as Johan Sverdrup Phase 2 continues to ramp up.
China’s total oil production was up to 4.18 million b/d in 2022 from 4.06 million b/d in 2021 thanks to strong capital spending. China’s oil supply is expected to increase to 4.22 million b/d in 2023.
Meantime, product cracks in November 2022 eased from record highs in the previous month as European supply shortages caused by strike actions were resolved and product exports from China rose. However, global product markets continue to be tight, especially the EU diesel market.
Global refinery throughputs are expected to increase by 1.6 million b/d in 2023, following an increase of 2.3 million b/d in 2022. Product markets are likely to face a host of new disruptions in 2023, including an overhaul of crude and product trade following the EU’s ban on Russian imports, the trajectory of Chinese product exports and the timing of new refinery start-ups.
OECD oil stocks
At the end of October 2022, OECD industry inventories reached 2,765 million bbl, narrowing the deficit versus the 5-year average of 2017-2021 to 150.2 million bbl from a peak of 317.4 million bbl in May 2022.
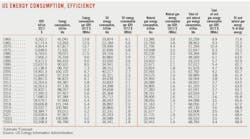
US oil consumption was estimated to average 20.36 million b/d in 2022, compared with 19.87 million b/d in 2021, an increase of 2.45%, according to the latest Energy Information Administration (EIA) data.
OGJ forecasts that total US oil consumption will average 20.5 million b/d in 2023, an increase of 143,000 b/d (0.72%) from the 2022 level. Increased consumption of jet fuel and hydrocarbon gas liquids (HGL) are the main drivers of the overall growth.
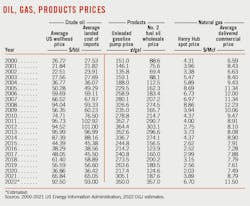
Demand for motor gasoline for 2022 is estimated to have averaged 8.77 million b/d, 0.5% lower than a year ago. Demand for motor gasoline will continue dropping 0.2% in 2023 due to slowing economic growth and higher retail prices. National average prices for retail gasoline were close to $3.05/gal for 2022, compared with $2.17/gal in 2021. In 2023, retail gasoline prices are forecast to increase further.
Demand for HGL for 2022 is estimated to have averaged 3.65 million b/d, 6.1% higher than a year ago. OGJ expects that HGL demand will increase by 105,000 b/d (2.9%) in 2023.
US consumption of distillate fuel averaged 3.98 million b/d in 2022, up 0.2% from a year ago. According to data from the US Bureau of Transportation Statistics, trucking freight year-to-date, as measured by the truck tonnage index (seasonally adjusted), indicated a growth of 3.9% in 2022, compared with growth of 0.1% in 2021. OGJ forecasts that US consumption of distillate fuel will decrease slightly in 2023, reflecting tepid economic growth.
US jet fuel consumption rose by an estimated 190,000 b/d (13.96%) in 2022. According to the International Air Transport Association (IATA), US revenue passenger miles (RPM) over the first 9 months of 2022 climbed 48% compared with the same period a year ago. However, average jet fuel consumption in the US in 2022 has been consistently below 2019, although airline passenger counts have nearly returned to 2019 levels in recent months. The increasing number of passengers and yet unchanged jet fuel demand may reflect airlines’ measures to ensure full flights. Constraints on labor supply, as well as high fuel prices, have led air carriers to consolidate flights despite growing passenger demand. OGJ forecasts that US jet fuel consumption will expand by 4% in 2023.
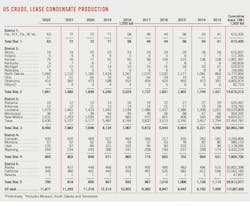
Total oil supply in the US is estimated to have increased by 1.1 million b/d in 2022 to average 17.83 million b/d. Annual average US crude oil production reached 11.87 million b/d in 2022, up 5.5% from the 2021 level, according to data from EIA. HGL production at natural gas processing plants grew 9.8% in 2022 to 5.96 million b/d.
According to rig count data released by Baker Hughes, the number of active US oil rigs was 620 for the week ended Dec. 16, compared with 475 active oil rigs a year ago and 263 for the same period in 2020. Gains come mostly from the Permian basin, with growth in onshore oil rigs accounting for nearly 40% of the US total in 2022. However, despite an increase in the number of active oil rigs earlier in 2022, the rig count has remained relatively flat since July 2022.

DUC wells in the US have been declining rapidly since mid-2020. The number of wells completed on a monthly basis has exceeded the number of wells drilled since July 2020, leading to fewer DUC wells in the US. DUC wells fell sequentially from a high of 8,800 in June 2020 to 4,408 in October 2022, according to the EIA Drilling Productivity Report (DPR).
The decline in the number of DUCs has coincided with high oil prices and contributed to the increase in US oil production. Due to the lag between drilling and completion, a reduction in DUCs could limit future crude oil production growth without more drilling being undertaken.
According to preliminary capital guidance for 2023 released by operators, cost inflation is starting to moderate as some supply chain bottlenecks start to ease. However, fracking equipment—currently at maximum capacity—is expected to remain constrained. In addition to supply chain pressures and prioritization of shareholder returns, natural gas takeaway capacity has become strained as drilling has expanded into areas with higher associated gas in the Permian basin.
In 2022, production of the Gulf of Mexico averaged 1.75 million b/d, up 2.64% from a year ago, as more than 100,000 b/d of new production capacity came online with the start-up of Murphy Oil’s Kings Quay and Shell’s Power Nap projects. Crude oil production in the Gulf of Mexico is expected to continue growing through 2023, driven by new projects coming online. New capacity in the Gulf of Mexico is expected to reach 220,000 b/d in 2023, with gains coming from BP’s Mad Dog Phase 2 and Shell’s Vito.
OGJ forecasts HGL production at natural gas processing plants will grow to 6.32 million b/d in 2023 from an estimated 5.96 million b/d in 2022. Combined, US total domestic oil production in 2023 is expected to grow 5.8% from a year ago to 18.86 million b/d.

Persistently low inventories, especially of middle distillates, strike action and long-term maintenance in Europe, global capacity constraints, and the EU ban on Russian imports are providing strong support for elevated margins of US refiners.
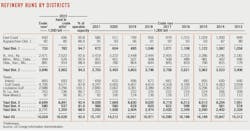
Refining cash margins for the first 11 months of 2022, the latest data available, averaged $37.00/bbl for the Midwest, $30.19/bbl for the West Coast, $28.41/bbl for the Gulf Coast, and $22.98/bbl for the East Coast, according to Muse Stancil & Co. These compared with cash refining margins of $15.89/bbl, $13.17/bbl, $8.38/bbl and $6.70/bbl, respectively a year ago. For the same period in 2020, these refining margins averaged $6.87/bbl, $7.12/bbl, $2.20/bbl, and $1.02/bbl.
The combination of a slight contraction in the US economy and maximizing refinery distillate production will keep distillate prices and diesel refining margins lower in 2023 than in 2022. However, the EU ban on seaborne imports of oil products from Russia creates supply and price uncertainty in the distillate market.
US refining capacity averaged 17.97 million b/d during 2022, compared with 18.11 million b/d for 2021. New refinery capacity is to be added in first-half 2023 with the expansion of ExxonMobil’s Beaumont refinery.
US oil trade
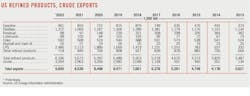
US exports of crude oil and petroleum products hit an all-time high of just under 10 million b/d in 2022, OGJ estimates. Importantly, overall oil exports from the US to the EU increased by 52.2% y-o-y in the first 9 months of 2022, whilst to the UK increased by 47% y-o-y. The EU is now the destination of one third of total US crude oil exports, according to weekly reports from shipbroker Banchero Costa and vessels tracking data from Refinitiv.
India was a top destination of US crude oil exports in 2021. Over the first 9 months of 2021, US crude exports to India averaged 412,000 b/d, up 73.42% over the same period in 2020. However, US crude oil exports to India averaged only 284,000 b/d over the first 9 months of 2022 as India ramped up its crude imports from Russia at discounted prices.
The US exported nearly 6 million b/d of petroleum products in the first 3 quarters of 2022, compared with 5.4 million b/d over the same period a year ago. Mexico received the largest share of US petroleum products exports at 1.2 million b/d, followed by Canada at 511,777 b/d, and Japan at 450,777 b/d.
In the first 9 months of 2022, the US exported an average of 2.37 million b/d of HGL, a growth of 85,110 b/d (3.72%) compared with the same period in 2021. Japan was the major destination for US HGL exports, receiving 16% of total US HGL exports. Aside from Japan, US HGL exports went mostly to China, Canada, and Mexico.
Propane exports averaged 1.35 million b/d, an increase of 4.26% compared with the same period in 2021. Japan received the largest share of US propane exports at 399,000 b/d, followed by Mexico at 202,666 b/d, and China at 97,000 b/d.
In the first 9 months of 2022, the US exported an average of 1.27 million b/d of distillate, an increase of 22.6% compared with the same period in 2021. Mexico received the largest share of US distillate exports, followed by Brazil and Chile. The US also exported an average of 872,111 b/d of gasoline, a 12.5% increase with the same period in 2021. The top destination for US gasoline exports was Mexico.
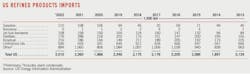
During 2022’s first three quarters, the US imported 6.3 million b/d of crude oil, compared with 6.1 million b/d for the same period a year ago. Crude oil imports from OPEC members averaged 960,000 b/d, compared with 770,000 b/d in the first three quarters of 2021. The US’s crude imports from Saudi Arabia for the first three quarters in 2022 climbed to 457,000 b/d from 326,800 b/d during the previous year’s first 3 quarters. The leading source of US crude imports was Canada, which supplied 3.83 million b/d.
In the first three quarters of 2022, the US imported 2.06 million b/d of petroleum products, down from 2.43 million b/d in the same period a year ago.
US oil stocks
Crude inventories in the Strategic Petroleum Reserve (SPR) were 371 million bbl at yearend 2022, compared with 594 million bbl at yearend 2021. The US Department of Energy (DOE) announced a notice of sale of as much as 15 million bbl of crude oil from the SPR on Oct. 18, 2022, to help address the market supply disruption caused by Russia’s full-scale invasion of Ukraine and to help lower energy costs. This sale completes the 180 million bbl sale of crude oil from the SPR that President Biden announced in the spring of 2022.
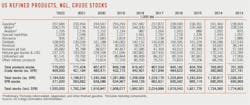
US commercial crude inventories at yearend 2022 were estimated at 409 million bbl, down from 421 million bbl at yearend 2021.
Total estimated product stocks at yearend 2022 were 775 million bbl, compared with 777 million bbl a year ago. The decrease reflected lower net imports, disruptions in global petroleum trade following Russia’s full-scale invasion of Ukraine, and a reduction in exports of petroleum products from China.
Motor gasoline inventories stood at 235 million bbl at end 2022, compared with 232 million bbl at yearend 2021. Jet fuel stocks finished 2022 at 35 million bbl, compared with 36 million bbl at end 2021, and inventories of distillate fuel oil finished 2022 at 123 million bbl, compared with 130 million at end 2021.
US natural gas
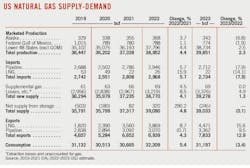
Thanks to strong LNG exports and low inventories, spot natural gas prices at Henry Hub averaged $6.70/MMbtu in 2022, compared with $3.91/MMbtu in 2021, $2.03/MMbtu in 2020, and $2.56/MMbtu in 2019. In 2023, gas prices are expected to decline to around $5/MMbtu, largely due to rising production and lower domestic demand. However, as growth in LNG exports remain strong, the possibility of price volatility remains high.
Temperatures in winter 2022-2023, based on the most recent forecast of heating degree days from the National Oceanic and Atmospheric Administration (NOAA), are expected to be 6.9% higher than last winter and 2.4% higher than the 10-year average.
Natural gas consumption in the industrial sector averaged 23.44 bcfd in 2022, 3.12% higher than the 2021 level and accounting for about 26.5% of total domestic gas consumption. Residential and commercial gas consumption climbed 4.9% and 6.7%, respectively, compared with 2021 levels.
US natural gas consumption in 2023 is expected to decrease 3.45% from a year ago, averaging 85.47 bcfd, OGJ forecasts. The decrease in consumption reflects lower consumption in the electric power and industrial sectors, reflecting tepid economic growth and relatively high gas spot prices.
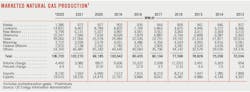
In 2022, US natural gas production, as measured by marketed production and dry natural gas production, was 106.72 bcfd and 98.11 bcfd, representing y-o-y increases of 4.4% and 3.8%, respectively, and setting annual records.
US dry natural gas production is projected to grow to an average of 101 bcfd over the year in 2023, about 2% higher than in 2022. Production in first-half 2023 will likely be limited by pipeline constraints and lower natural gas prices. In the second half of the year, developers have scheduled more pipeline infrastructure expansion projects, which will help increase dry gas production.
US LNG exports are expected to increase further by 16% to 12.25 bcfd in 2023, driven by increased demand and export capacity. Freeport LNG Development LP in mid-November—the most recent update at press time—noted plans to resume initial operations at the LNG plant in December and ramp up production to about 2 bcfd in January 2023. When Freeport LNG resumes, US LNG exports are expected to hit a new record of nearly 12.5 bcfd in March 2023. In addition, liquefaction plants are likely to continue operating near maximum capacity to meet high demand for natural gas in Europe and Asia.
Meanwhile, US natural gas pipeline exports to Mexico declined in 2022. Mexico increased its domestic natural gas production by 15% during the first 7 months of 2022 compared with the same period in 2021. The recent increase in Mexico’s domestic production was driven primarily by Quesqui and Ixachi fields, which produce a higher proportion of dry natural gas. Recent improvements in drilling rigs’ operating efficiency have also contributed to rising natural gas production.
According to the EIA’s weekly natural gas storage report, working natural gas stocks reached 3,644 bcf as of Nov. 11, 2022, almost in line with the 5-year average and exceeding year-ago levels. An increase in injections during the final weeks of the refill season reversed what had been a below-average year for storage injections. The increase reflects growth in US dry gas production and the shut-in at the Freeport LNG plant.
About the Author

Conglin Xu
Managing Editor-Economics
Conglin Xu, Managing Editor-Economics, covers worldwide oil and gas market developments and macroeconomic factors, conducts analytical economic and financial research, generates estimates and forecasts, and compiles production and reserves statistics for Oil & Gas Journal. She joined OGJ in 2012 as Senior Economics Editor.
Xu holds a PhD in International Economics from the University of California at Santa Cruz. She was a Short-term Consultant at the World Bank and Summer Intern at the International Monetary Fund.

Laura Bell-Hammer
Statistics Editor
Laura Bell-Hammer is the Statistics Editor for Oil & Gas Journal, where she has led the publication’s global data coverage and analytical reporting for more than three decades. She previously served as OGJ’s Survey Editor and had contributed to Oil & Gas Financial Journal before publication ceased in 2017. Before joining OGJ, she developed her industry foundation at Vintage Petroleum in Tulsa. Laura is a graduate of Oklahoma State University with a Bachelor of Science in Business Administration.