OGJ150 firms post strong 2021 earnings on higher commodity prices
The OGJ150 group of oil and gas producers recorded strong financial results in 2021, compared to massive losses reported in 2020, reflecting the rebound in commodity prices.
Brent crude oil averaged $71/bbl for full-year 2021, compared to $42/bbl in 2020 and $64/bbl in 2019. WTI prices averaged $68/bbl throughout 2021, compared to $39.40/bbl in 2020 and $57/bbl in 2019. The rise in WTI and Brent prices in 2021 from 2020 mainly reflected OPEC+’s decision to comply with previously agreed output cuts. In addition, global demand for crude oil has increased as economic conditions have improved due to the reduction of early COVID-19 restrictions.
NYMEX natural gas prices averaged $3.85/MMbtu in 2021, compared to $1.98/MMbtu for 2020 and $2.63/MMbtu in 2019. The increase in NYMEX natural gas prices for 2021 primarily reflected higher North American demand following the impact of COVID-19 in 2020, as well as lower storage levels.
In 2021, the OGJ150 group reported a combined net income of $71 billion, compared with a combined net loss of $112.23 billion in 2020. The OGJ150 companies also reported yearend assets totaling $1,135 billion, a 11.77% increase from yearend 2020 assets for the same group. Capital expenditures of the group decreased slightly, by 1.2% in 2021 from a year ago, reflecting strict capital discipline.
The OGJ150 group also registered a dramatic increase in US and worldwide liquids and gas reserves compared to a year ago, partly reflecting higher commodity prices and corresponding upward revisions.
To qualify for the OGJ150, oil and gas producers must be US headquartered, publicly traded, and hold oil or gas reserves in the US. Companies appear on the list ranked by total assets but are also ranked by revenues, stockholders’ equity, capital expenditures, earnings, production, reserves, and US net wells drilled.
Comparisons between totals for one year’s OGJ150 with those for another year must consider company changes. But for any given year, the OGJ list represents a significant portion of the US oil and gas industry and therefore accurately reflects industry activity and financial performance trends.
As always, data for this year’s list reflect the prior year’s operations.
Group changes
The OGJ150 group now contains 85 companies, the same as the number in the previous compilation. This is the second time on record that the number of the companies on this survey is fewer than 100.
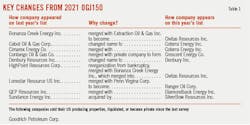
Six companies listed last year dropped from the list this year due to various reasons, mostly being revoked from SEC. Goodrich Petroleum Corp. was merged with Paloma Natural Gas LLC to become private.
This year’s list contains six companies that were not on the list in the previous year. They are Brigham Minerals Inc., HighPeak Energy Inc., Kimbell Royalty Partners, Mesa Royalty Trust, PermRock Royalty Trust, and Texas Pacific Land Corp.
Other changes include: Bonanza Creek Energy Inc. merged with Extraction Oil & Gas Inc. to become Civitas Resources Inc.; Cabot Oil & Gas Corp. changed its name to Coterra Energy Inc.; Cimarex Energy Co. merged with Coterra Energy Inc.; Contango Oil & Gas Co. merged with a private company to form Crescent Energy Co.; Denbury Resources Inc. changed its name to Denbury Inc.; HighPoint Resources Corp. filed bankruptcy and merged with Bonanza Creek Energy Inc. into Civitas Resources Inc.; Lonestar Resource US Inc. merged with Penn Virginia Corp. to become Ranger Oil Corp.; QEP Resources Inc. was acquired by Diamondback Energy Inc.; and Sundance Energy Inc. was acquired by SilverBow Resources Inc.
Five companies on this year’s list are publicly traded limited partnerships (LPs). They are Black Stone Minerals LP, Dorchester Minerals LP, Everflow Eastern Partners LP, Apache Offshore, and Kimbell Royalty Partners. Kimbell Royalty Partners is new to the list. Atlas Growth Partners LP, which was on this list last year, dropped off.
There are 10 royalty trusts listed this year. They are PermRock Royalty Trust, Permianville, VOC, MV Oil, San Juan, Cross Timbers, Mesa Royalty Trust, Sabine, Permian Basin, and Gulf Coast Ultra Deep Royalty Trust.
Group financial performance
Supported by higher commodity prices, the OGJ150 group reported a combined net income of $71 billion for 2021. This compared to a combined net loss of $112.23 billion for 2020.
The group’s collective revenues increased 68.8% in 2021 to $671.3 billion. Assets for the current OGJ150 group totaled $1,135.4 billion at end 2021, compared with $1,015.8 billion a year ago for the same group.
Fifty-eight companies in the OGJ150 posted a profit in 2021, compared with only 17 such companies in 2020. There were also 30 companies posting net income of over $100 million in 2021.
Twenty-seven companies reported net losses. This compares with 69 such companies in 2020 and 59 such companies in 2019. In 2021, eight of the OGJ150 companies had losses exceeding $100 million, compared to 50 in 2020, and 30 in 2019.
Total stockholders’ equity of the companies increased 20.4% from a year ago to $560.65 million in 2021.
Capital and exploration expenditures of the group decreased 1.2% to $62.9 billion, reflecting strict capital disciplines. Return on assets for the OGJ150 group increased to 6% in 2021 from a negative 11% in 2020. Return on revenues for the OGJ150 group increased to 11% in 2021 from a negative 28% in 2020.
Group operations
The OGJ150 group’s worldwide liquids production increased 5% to 3.7 billion bbl in 2021, while US production by the group grew 8.55% to 2.67 billion bbl.
By end 2021, group worldwide liquids reserves increased 28.57% to 42 billion bbl. US liquids reserves for the group increased 32.44% to 29.5 billion bbl. The increase in reserves reflects higher oil prices in 2021.
Worldwide natural gas production for the OGJ150 group increased 8.61% to 18.27 tcf in 2021. Group natural gas production in the US increased 11% to 13.81 tcf.
Group natural gas reserves in the US increased 29.5% to 183.54 tcf in 2021. On a worldwide basis, the group booked a gas reserves increase of 22.74% to 230.65 tcf.
The group’s total US net wells drilled increased 17.4% to 5,498 in 2021 from 4,683 in 2020.
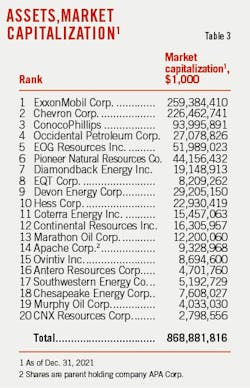
Top 20 companies by assets
ExxonMobil retains the top spot, reporting $338.92 billion in assets at yearend 2021, up from the $332.75 billion in the previous year. It is followed by Chevron, ConocoPhillips, Occidental Petroleum, and EOG Resources.
Diamondback Energy Inc. is now ranked No. 7, up from No. 10 last year. Its assets at yearend 2021 increased to $22.89 billion from $17.62 billion at yearend 2020. The increase in assets was largely due to the acquisition of QEP Resources.
Devon Energy Corp. moved to No. 9 this year from No. 16 last year. Its assets at yearend 2021 increased to $21 billion from $9.9 billion at yearend 2020. Devon Energy and WPX Energy merged in early 2021.
Coterra Energy Inc. rose to No. 11 this year from No. 26 last year, reflecting its merger with Cimarex Energy.
Hess Corp. dropped to No. 10 this year from No. 7 last year.
The top 20 companies had total assets of $1,044 billion at yearend 2021, representing 92% of the entire group’s assets. This compares to $942.6 billion for the top 20 a year ago, which accounted for 92.7% of the group’s total.
The top 20 companies by assets received revenues of $635.6 billion in 2021, up from $377 billion in 2020. Collectively, these firms posted 2021 net income of $66.62 billion, compared to a combined net loss of 86.97 billion in 2020. In 2021, the revenues and net income for the top 20 were respectively 94.7% and 93.7% of the group total. A year ago, these ratios were 94.8% and 77.5%, respectively.
The top 20 companies by assets produced 12.62% more liquids in the US last year, totaling 2.23 billion bbl. Their liquids production worldwide increased 6.68% to 3.23 billion bbl. Their natural gas production increased 14.23% in the US and 10.33% worldwide year-over-year.
The top 20’s liquids reserves climbed 36.63% in the US and 30% worldwide, respectively. Their natural gas reserves in 2021 also increased both in the US and worldwide, by 32.5% and 23%, respectively.
Capital and exploratory expenditures in 2021 by the top 20 totaled $54 billion, down from $55.77 billion in 2020. Expenditures of the top 20 amounted to 85.9% of the OGJ150 total last year. This ratio was 87.5% a year earlier.
The top 20 companies drilled 4,057 net wells in 2021, 389 more than in 2020 and accounting for 73.7% of wells drilled by the whole OGJ150 group. However, this is down from 78.3% in 2020. Comparatively, companies outside the top 20 drilled 1,441 net wells in 2021, 425 more than a year earlier.
Earnings leaders
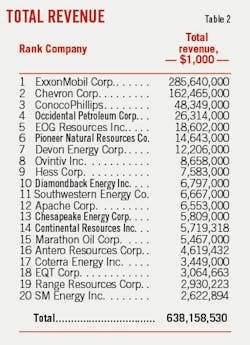
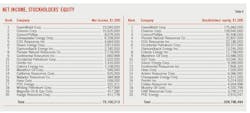
ExxonMobil, Chevron, ConocoPhillips, Chesapeake Energy Corp., and EOG Resources top this year’s list of net income leaders.
ExxonMobil posted net income of $23 billion in 2021, compared to a net loss of $22.44 billion for 2020. ExxonMobil’s 2021 liquids production of 2.3 million b/d decreased 60,000 b/d year-over-year, reflecting higher demand and growth more than offset by entitlements, decline, and divestments. Natural gas production available for sale was 8.5 bcfd, which increased 66 MMcfd from 2020, reflecting higher demand, partly offset by divestments and Groningen production limit.
Chevron recorded a profit of $15.6 billion in 2021, compared to a net loss of $5.5 billion for 2020. The company’s worldwide net oil-equivalent production in 2021 was a record 3.2 million b/d. About 27% of the company’s net oil-equivalent production in 2021 occurred in OPEC+ member countries.
ConocoPhillips reported a profit of $8 billion for 2021, compared to a loss of $2.7 billion in 2020. The company produced 1.57 MMboe/d (including Libya) and made two acquisitions that added production.
EOG Resources posted earnings of $4.66 billion for 2021 vs. a net loss of $605 million a year earlier. In the Delaware basin, EOG completed 288 net wells during 2021, primarily in the Wolfcamp, Bone Spring, and Leonard plays.
Hess reported earnings of $559 million in 2021, compared to a loss of $3.1 billion in 2020. In 2021, net production averaged 315,000 boe/d, including Libya, compared with 331,000 boe/d in 2020. The year-over-year decrease was primarily the result of lower Bakken production and the sale of interests in Shenzi field in the Gulf of Mexico in 2020 and South Arne field in Denmark in 2021, which was partially offset by higher production from the Liza Phase 1 development in Guyana and more stable operations in Libya.
Occidental Petroleum recorded a profit of $1.52 billion, compared to a net loss of $15.67 billion in 2020. The OxyChem business had its highest earnings in over 30 years.
Top 20 in capital spending, drilling
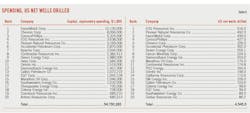
With $13.13 billion in outlays in 2021, ExxonMobil leads the OGJ150 group in capital expenditures. Chevron is the second, with $8 billion in expenditures, followed by ConocoPhillips, EOG Resources, and Pioneer Natural Resources.
The collective outlays of the top 20 capital spending leaders totaled $54.75 billion, compared with the previous top 20’s spending of $55.77 billion in 2020.
The top 20 companies in number of US net wells drilled reported 4,545 wells for 2021, up from 4,010 wells in 2020, in response to higher prices.
With a count of 516 wells, EOG Resources led the group in the number of net wells drilled in the US during 2021. The company also led the group for its number of net wells drilled in the US during 2020, with a count of 548.
Pioneer Natural Resources drilled 492 net wells in the US in 2021, compared to 230 a year earlier and is the second company on the current list. ExxonMobil drilled 439 net wells in the US last year, ranked at No. 3 and up from 422 wells drilled in 2020.
Chevron drilled 326 net wells in the US in 2021, down from 546 drilled a year ago.
Liquids reserves, production leaders
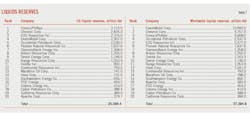
ExxonMobil, Chevron, and ConocoPhillips top the OGJ150 group in worldwide crude oil, condensate, and NGL reserves. Occidental Petroleum is ranked fourth in terms of worldwide liquids reserves.
ExxonMobil’s worldwide liquids reserves increased to 10.99 billion bbl from 7.64 billion bbl a year ago, registering the largest increase in the group. The increase in reserves was mainly a result of higher average prices in 2021, as certain quantities of crude oil, bitumen, and natural gas that did not qualify as proved reserves in the prior year qualified as proved reserves at yearend 2021.
Chevron’s liquids reserves around the world increased to 4.7 billion bbl at end 2021, up from 4.47 billion bbl at end 2020. ConocoPhillips’ worldwide liquids reserves increased to 3.6 billion bbl at end 2021, up from 2.4 billion bbl at end 2020.
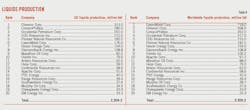
With 313 million bbl of output, Chevron produced the most liquids in the US during 2021, followed by ConocoPhillips, Occidental Petroleum, and EOG Resources.
ConocoPhillips’ liquids reserves in the US recorded an increase of 64% in 2021 to 3.1 billion bbl, topping the group. The operator is followed by Chevron, EOG, and ExxonMobil. In 2021, ConocoPhillips completed two acquisitions significantly increasing its Permian position in the Lower 48. On Jan. 15, 2021, ConocoPhillips completed the acquisition of Concho adding complementary acreage across the Delaware and Midland basins. On Dec. 1, 2021, the company completed the acquisition of Shell’s Delaware basin position adding significant Texas acreage.
Gas reserves, production leaders
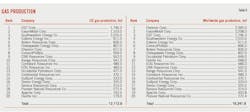
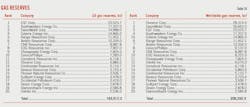
The company with the most worldwide gas reserves in 2021 is Chevron, followed by ExxonMobil, EQT Corp., Southwestern Energy, and Coterra Energy.
Chevron Corp.’s worldwide natural gas reserves increased to 28.3 tcf in 2021 from 27 tcf in 2020. ExxonMobil’s worldwide natural gas reserves increased to 26.66 tcf in 2021 from 25.2 tcf in 2020.
EQT’s proved gas reserves increased 25% in 2021 to 23.5 tcf because of acquisitions from Alta Resources Development LLC and Reliance Marcellus LLC, as well as extensions, discoveries, and other additions.
ConocoPhillips’ worldwide gas reserves increased to 9.13 tcf in 2021 from 6 tcf in 2020. The operator revised up its reserves in Alaska, Lower48, Canada, and Europe due to higher gas prices and technical revision.
EQT Corp. leads the group in US gas reserves, followed by Southwestern Energy, ExxonMobil, Coterra Energy, and Range Resources.
Following Chevron in Worldwide gas production are ExxonMobil, EQT Corp., Southwestern Energy, Coterra Energy Inc., and ConocoPhillips.
Fast-growing companies
Ranking for the OGJ150 list of the fastest growing companies is based on growth in stockholders’ equity. Companies are required to have positive net income for 2021 and 2020 and have an increase in net income in 2021. Subsidiary companies, newly public companies, and limited partnerships are not included.
Coterra Energy Inc., formerly known as Cabot Oil & Gas Corp., led the list this year. Its stockholder’s equity moved up to $11.7 billion from $2.2 billion a year earlier, and its net income increased to $1.16 billion from $200 million in 2020. The company ranked No. 11 in the group by assets. However, the company’s long-term debt also increased to $3.12 billion in 2021 from $946 million in 2020.
Civitas Resources Inc. was ranked second on the list and No. 22 in total assets. The company’s stockholder’s equity jumped to $4.65 billion in 2021 from $1 billion in 2020.
Sabine Royalty Trust posted an increase in stockholders’ equity of $11 million to $14.9 million and its net income increased to $57.85 million in 2021 from $33.3 million in 2020.
About the Author
Conglin Xu
Managing Editor-Economics
Conglin Xu, Managing Editor-Economics, covers worldwide oil and gas market developments and macroeconomic factors, conducts analytical economic and financial research, generates estimates and forecasts, and compiles production and reserves statistics for Oil & Gas Journal. She joined OGJ in 2012 as Senior Economics Editor.
Xu holds a PhD in International Economics from the University of California at Santa Cruz. She was a Short-term Consultant at the World Bank and Summer Intern at the International Monetary Fund.
Laura Bell-Hammer
Statistics Editor
Laura Bell-Hammer is the Statistics Editor for Oil & Gas Journal, where she has led the publication’s global data coverage and analytical reporting for more than three decades. She previously served as OGJ’s Survey Editor and had contributed to Oil & Gas Financial Journal before publication ceased in 2017. Before joining OGJ, she developed her industry foundation at Vintage Petroleum in Tulsa. Laura is a graduate of Oklahoma State University with a Bachelor of Science in Business Administration.
