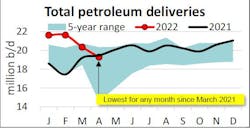
API: US petroleum demand falls to lowest level in a year
Excluding the 2020 and 2021 COVID-19 pandemic, the 2-month decrease was the largest since September 2008. Out of the 1.2 million b/d decrease since February, 1 million b/d was “other oils” (naphtha, gasoil, propane, propylene) that feed refinery and petrochemical operations, including packaging, films, and medical plastics.
Gasoline demand remained near 8.7 million b/d in April, showing decreases of 0.1% month-on-month (m-o-m) from March and 0.8% year-on-year (y-o-y). Excluding the 2020 COVID-19 pandemic, US gasoline demand since 2012 increased by averages of 1% m-o-m between March and April and 3.4% between February and March. Therefore, the past 2 months departed from these historical monthly changes.
Deliveries
Distillate deliveries of 3.9 million b/d decreased by 2.5% from March and by 3.2% compared with April 2021. DAT iQ industry trendlines showed that spot trucks available in April fell by 2.8% m-o-m, while the number of available spot loads decreased by 27% m-o-m, which were consistent with slowed freight trucking.
Kerosene-type jet fuel deliveries of 1.5 million b/d in April were up by 3.3% from March and 21.5% compared with April 2021—on par with April 2015 and 2016 levels. High-frequency data from Flightradar24 and TSA showed that the numbers of flights decreased by 1.7% m-o-m while air passenger volumes rose by 3% m-o-m, consistent with the International Air Transport Association (IATA) reports that passenger traffic continued to recover but air cargo decreased along with economic conditions.
Deliveries of residual fuel oil were 500,000 b/d in April, which reflected an increase of 25.6% from March and more than triple (222% y-o-y) the level in April 2021. Although global marine shipping markets have remained historically tight, it appears likely that fuel substitution of distillates for relatively less expensive residual fuel oil continued in April.
Deliveries of refinery and petrochemical liquid feedstocks—naphtha, gasoil, and propane/propylene (other oils)—were 4.9 million b/d in April, down by 1 million b/d from March. The drop likely reflected a combination of slower broad economic activity and less demand for medical plastics, films, and packaging.
US crude oil production of 11.8 million b/d in April increased by 1.4% from March and 5.4% compared with April 2021. This remained 1.1 million b/d below the highest US crude oil production, which occurred in November 2019.
Baker Hughes reported 549 active oil-directed rigs in April, a 4% increase from March but 33.2% less than the 821 rigs that ran in April 2019, which as a benchmark preceded the strongest US crude oil production later that year.
Natural gas-directed drilling rose by 5.2% m-o-m (7 rigs) to 143 rigs in April at the same time as natural gas spot prices at Henry Hub increased by 34.7% m-o-m to $6.6/MMbtu. NGL production fell by 2.3% m-o-m to 5.6 million b/d, but was still at its highest level for the month of April on record since 1973. On net for April, the decrease in NGL production offset the increase in crude oil production.
The US was a net exporter of petroleum—crude oil and refined products—of 1.4 million b/d in April, up from net exports of 500,000 b/d in March. The monthly change was driven by 400,000 b/d m-o-m lower total petroleum imports, coupled with 400,000 b/d m-o-m higher total petroleum exports. This was driven by Russia’s war in Ukraine, which increased the pull for US petroleum exports while also making imports relatively more expensive in April.
In April, US refinery throughput, measured by gross inputs into crude distillation units, was 16.2 million b/d and implied a capacity utilization rate of 90.1%. The throughput rate rose by 3.4% y-o-y from April 2021 and was at its 7th highest for the month of April on record since 1985. The capacity utilization rate also was the highest for the month since 2018 and the second straight month sustained over 90%, as refiners continued to run infrastructure near the highest rates seen in the past 5 years.
Total petroleum inventories, including crude oil and refined products (excluding the Strategic Petroleum Reserve) of 1.17 billion bbl increased by 0.2% from March and decreased 9.5% compared with April 2021 to their lowest level for the month since 2014. US crude oil inventories increased by 1.6% m-o-m to 418 million bbl but fell by 14.6% from 1 year ago, also to their lowest for the month since 2014.
Typically, through April of each year compared with December of the prior year, US commercial crude oil inventories have risen by an average of more than 40 million bbl (2005-2021), in advance of refining activity for the summer driving season. However, as of April 2022 US crude oil inventories decreased by 3.4 million bbl.
