API: February US oil demand strongest since August 2005
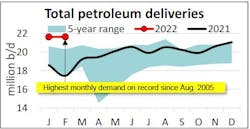
US petroleum demand, as measured by total domestic petroleum deliveries, was 21.6 million b/d in February, only 0.03% above demand in January, according to the latest monthly statistical report by the American Petroleum Institute (API). However, this was its highest for the month February on record since 1963 and its highest for any month since August 2005.
As a benchmark to before the pandemic, the demand reflected an increase of 6.6% compared with Feb. 2019. “Other oils” (including naphtha, gasoil, propane, and propylene) that feed refinery and petrochemical operations, including packaging and medical plastics, remained strong. Motor gasoline increased in February, offsetting monthly decreases in distillates, jet fuel, and residual fuel oil.
Urban commuting returned motor gasoline demand to near the top of the 5-year range. Consumer gasoline demand, measured by motor gasoline deliveries, was 8.7 million b/d in February. This reflected an increase of 4% month-on-month (m-o-m) but was 3.8% below its level in February 2019. Deliveries of reformulated-type gasoline (consumed primarily in urban areas) rose to 2.8 million b/d and were up by 5.6% m-o-m from January. By comparison, conventional gasoline (consumed mainly in rural areas) increased by 3.2% year-on-year (y-o-y) to 5.9 million b/d. The relative changes are consistent with a recovery in urban commuting as the Omicron variant of the pandemic eased.
Distillate deliveries of 4.3 million b/d decreased by 3.1% m-o-m from January but were at their highest for any month since 2015. They also were at their highest for any month since October 2018. Consistent with demand data, DAT iQ industry trendlines suggested that spot freight truck posts increased by 3.9% m-o-m from January and by 12.9% y-o-y compared with February 2021.
Kerosene-type jet fuel deliveries of 1.4 million b/d in February decreased by 1.3% m-o-m from January and remained 10.1% less than they were in February 2019. High-frequency data from Flightradar24 and TSA showed that air passenger volumes remained down by more than 15% in February 2022 compared with February 2019, but the total number of tracked (passenger and cargo) flights was 5.2% higher over the same period. The International Air Transport Association (IATA) characterized the Omicron variant as a speed bump but noted that impacts from the Russia war on Ukraine have not yet factored into the data.
Deliveries of residual fuel oil, which is used as a marine bunker fuel and internationally in electric power production, space heating and industrial applications, were 300,000 b/d in February, which was a decrease of 25.6% m-o-m from January but an increase of 8.6% compared with February 2019. Residual fuel oil demand has historically (2011- 2021) fallen by an average of 19.2% m-o-m between January and February, and despite the decrease in February 2022 the deliveries were their highest for the month of February since 2012.
Deliveries of refinery and petrochemical liquid feedstocks –naphtha, gasoil, and propane/propylene (“other oils”) – were 6.9 million b/d in February, down by 100,000 b/d m-o-m from January – and the second highest behind only January 2022. This represented 32% of US petroleum demand in February and likely reflected the strong continued refining and petrochemical demand for medical plastics and packaging.
Macroeconomy
API’s Distillate Economic Indicator™, which is based primarily on diesel/distillate supply, demand, and inventories, had a reading of 2.3 in February and a 3-month average of 1.8, suggesting that US industrial production and broader economic activity have continued to grow.
The Institute for Supply Management’s manufacturing Purchasing Managers Index (TPMI) had a reading of 58.6 in February, a 1.0 percentage point increase from January. Index values above 50 suggest an expansion in the overall economy, and the manufacturing PMI exceeded that threshold for a 20th consecutive month.
The University of Michigan’s consumer sentiment index decreased by nearly 30% to readings of 59.7 in early March and 62.8 in February from a January level of 84.9. The survey attributed the drop in the index to decreased inflation-adjusted incomes, rising fuel prices, and high year-ahead expected inflation rates. Notably, the February and March readings were at their lowest compared with any point with the pandemic since 2020.
According to the Bureau of Labor Statistics (BLS), the unemployment rate fell by 0.2% to 3.8% in February. Non-farm payrolls increased by a preliminary estimate of 678,000 m-o-m, their largest increase since July 2021.
US oil supply
US crude oil production of 11.6 million b/d in February increased by 0.1% m-o-m from January and was within 0.2% of its level in February 2019. Baker Hughes reported 516 active oil-directed rigs in February, a 5.2% m-o-m increase from January but 39.4% less than the 852 rigs that ran in February 2019.
By contrast, natural gas-directed drilling rose by 10.1% m-o-m (12 rigs) to 123 rigs in February as natural gas spot prices at Henry Hub of $4.69/MMbtu increased by 7.1% m-o-m from January. The extraction of natural gas liquids (NGLs) generally depends to the relative values of ethane, propane, and butane, which historically have tended to correspond with those of crude oil. However, NGL production decreased by 1.9% m-o-m to 5.6 million b/d.
International trade, refining, stocks
The US was a petroleum net importer of 800,000 b/d in February, whereas it had been a petroleum net exporter in February for each of the past 2 years. However, the monthly change showed net imports that were 800,000 b/d lower in February compared with January, driven mainly by higher exports of refined product exports and crude oil that accelerated in late February as the Russia escalated hostilities in Ukraine.
US refinery throughput was 15.9 million b/d in February, which was within 1.3% of its level in February 2019. This implied a capacity utilization rate of 87.9% that was the highest for the month of February since 2018.
Following a downward revision to January’s total petroleum inventories, including crude oil and refined products (but excluding the Strategic Petroleum Reserve), in February they increased by 0.2% m-o-m to 1.20 billion bbl. Other than January 2022, the February 2022 reading was the lowest for any month since March 2018. US crude oil inventories slipped by 0.1% m-o-m to 412.7 million bbl, their lowest for any month since August 2018. Crude oil inventories remained below their 5-year range and at their lowest level for the month since 2014.