API: US February petroleum demand down 2.5% year-over-year
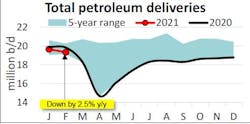
In February, US petroleum demand, as measured by total domestic petroleum deliveries, was 19.3 million b/d, according to the latest monthly statistical report from the American Petroleum Institute (API). This reflected decreases of 1.7% from January and 2.5% compared with February 2020 – relatively strong considering the 2020 COVID-19 recession and winter-related disruptions.
Consumer gasoline demand, measured by motor gasoline deliveries, was 7.9 million b/d in February. This represented an increase of 1.2% from January but an 11.6% decrease compared with February 2020. On average over the past 10 years, gasoline demand growth in the month of February averaged 3.4% m/m over that of January, so the 1.2% m/m change this year was less than half of the historical seasonality. Consequently, much of recent driving activity was likely borne out of necessity, as opposed to discretionary travel that could have produced the higher seasonal variation that has been historically observed.
In February, distillate deliveries of 4.1 million b/d rose by 2.9% from January and 3.1% y/y. Consequently, distillate / diesel fuel demand continued to exceed its pre-COVID-19 levels so far in 2021. DAT iQ industry trendlines showed strong growth of spot flatbed, van, and reefer truck loads in February. As capacity remained tight, freight volumes spilled into the intermodal and rail sectors.
Jet fuel deliveries were 1.1 million b/d in February, which was a decrease of 6% from January and 30.4% below the level of February 2020. This was consistent with Flightradar24 high-frequency data that showed a drop versus flights in January and February 2020.
Deliveries of residual fuel oil, which is used in electric power production, space heating, industrial applications and as a marine bunker fuel, were 0.28 million b/d in February. This reflected sharp seasonal increases of 52.2% from January and 88.7% compared with February 2020 to near the top of the five-year range.
Deliveries of liquid feedstocks, such as naphtha, gasoil, and propane/propylene (other oils) used primarily in refining and petrochemical manufacturing, were 5.9 million b/d in February. This was an increase of 20.7% y/y and a new high for the month of February. However, the 5.9 million b/d reflected a seasonal decrease from the record 6.5 million b/d in January, likely due to refining and petrochemical plant disruptions with the cold snap as well as February being a short month. Even still, other oils represented 30.4% of total US petroleum demand for the month, compared with its average 24.7% share between 2016 and 2020.
Prices
In February, West Texas Intermediate (WTI) crude oil prices rose to $59.04/bbl, a 13.5% increase m/m for its strongest monthly level since December 2019. By comparison, Brent crude oil spot prices averaged $62.28/bbl, and the Brent-WTI price differential widened to $3.24/bbl, its widest since February 2020. Although gasoline prices were historically low, they rose in February along with the crude oil prices, which remained the top input cost in making gasoline per EIA. The US average conventional gasoline price was $2.59/gal in February, up by 6.9% ($0.17/gal) from January and 2.1% y/y ($0.05/gal), according to AAAT.
Supply
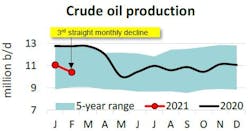
In February, US crude oil production was 10.4 million b/d, a 6% m/m decrease despite solid rig productivity and increased drilling activity. The decrease was led by Texas shut-ins during the regional cold snap in the latter half of February. Baker Hughes reported 305 active oil-directed rigs in February, a 6.5% m/m increase (but 55% below the 678 rigs in February 2020). However, oil-directed rig productivity has held near record levels in most producing basins per EIA.
By comparison, natural gas-directed drilling in February rose by 5.4% m/m but remained down 17.2% y/y. Rig productivity gains for natural gas drilling supported marketed production of about 97 bcfd in February per EIA, a 5.8% m/m decrease which corresponded with the extraction of 4.4 million b/d of NGLs by API estimates. These figures reflected solid NGL demand during the cold snap coupled as well as increased fractionation along with higher NGL and crude oil prices.
International trade
The US reverted to being a petroleum net importer of 500,000 b/d in February. This was a shift from 400,000 b/d of petroleum net exports in January, with the monthly change driven by exports fell faster than imports for the month and was largely attributable to the winter weather emergency which hampered petroleum trade operations in the Houston ship channel, Corpus Christi, and South Louisiana ports.
Specifically, US petroleum exports fell to 7.2 million b/d, compared with 8.2 million b/d in January and 10.0 million b/d in February 2020. The 2.8 million b/d monthly decrease – made up of 900,000 b/d of crude oil and 1.9 million b/d of refined products. Meanwhile, the US imports of 7.7 million b/d of total petroleum – including 5.5 million b/d of crude oil and 2.2 million b/d of refined products in February – fell to their lowest levels for the month since 1992.
Refining, stocks
US refinery throughput was 13.4 million b/d in February, a 10.8% m/m and 18.3% y/y decrease. This implied a capacity utilization rate of 73.1% for the month, which fell by 8.9 points from January for the lowest February value on record. The declines were driven by the Gulf Coast and Midwest cold snap which shut-in large portions of refining capacity in PADD 3.
US total petroleum inventories, including crude oil and refined products but excluding the Strategic Petroleum Reserve rose off revised January figures to 1.35 billion bbl in February. The 0.2% m/m increase resulted in the 2nd highest inventory level for the month and was 7.1% below the June 2020 record highs. Within the total, crude oil stocks of 482.1 million bbl increased 1.3% m/m, while total products stocks decreased 0.3% m/m.

