February Henry Hub gas spot price highest monthly average since 2014
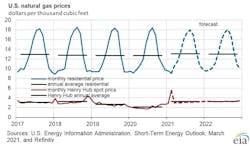
The Henry Hub natural gas spot price averaged $5.35/MMbtu in February, up from the January average of $2.71/MMbtu, and the highest nominal monthly average Henry Hub spot price since February 2014.
Higher reflect increased demand for natural gas because of much colder-than-normal temperatures throughout most of the country. Price effects were amplified because the rise in demand occurred amid a drop in natural gas production due to well freeze-offs.
In its latest Short-Term Energy Outlook, the US Energy Information Administration (EIA) expects Henry Hub spot prices to decline to an average of $2.88/MMbtu in second-quarter 2021. EIA also expects that Henry Hub spot prices will average $3.14/MMbtu in 2021, up from the 2020 average of $2.03/MMbtu. Continued growth in liquefied natural gas (LNG) exports, along with relatively flat production, will contribute to Henry Hub spot prices rising to an average of $3.16/MMbtu in 2022.
EIA expects that US consumption of natural gas will average 82.5 bcf/d in 2021, down 0.9% from 2020. The decline in US natural gas consumption reflects less natural gas consumed for electric power generation because of higher natural gas prices compared with last year.
According to EIA’s estimates, total natural gas consumption in February was the highest on record, at 111.8 bcfd, because cold weather affected much of the US and increased natural gas demand for heating and power generation. However, EIA expects natural gas consumption in March to decline from February levels as temperatures return closer to normal, based on forecasts by the National Oceanic and Atmospheric Administration. EIA expects US natural gas consumption will average 81.6 bcf/d in 2022.
The US ended October 2020 with more than 3.9 tcf in working natural gas storage, 5% more than the 2015–19 average and the fourth-highest end-of-October level on record. EIA estimates that inventory withdrawals were 829 bcf in February, the largest February withdrawal on record. The February 2021 withdrawal was significantly larger than the 5-year (2016–20) average February withdrawal of 452 bcf.
In mid-February, the combination of strong natural gas demand and lower production led to the second-largest weekly storage withdrawal on record, including a record weekly withdrawal of 156 bcf in the South Central region, which includes Texas. The large February withdrawal has resulted in end-of-month storage levels falling lower than their 5-year average. EIA forecasts that natural gas inventories will end March 2021 at 1.6 tcf, which is 13% lower than the 5-year average. EIA forecasts that natural gas inventories will ultimately end the 2021 injection season (end of October) at almost 3.7 tcf, which is 2% less than the 5-year average.
EIA forecasts that US production of dry natural gas averaged 87.8 bcfd in February, which is down from 92.4 bcfd in December (the most recent month with final data). The decline in natural gas production was mostly a result of freeze-offs, which occur when water and other liquids in the raw natural gas stream freeze at the wellhead or in natural gas gathering lines near production activities.
Unlike the relatively winterized natural gas production infrastructure in northern areas of the country, natural gas production infrastructure, such as wellheads, gathering lines, and processing facilities, in Texas are more susceptible to the effects of extremely cold weather.
For 2021, EIA expects that overall dry natural gas production will average 91.4 bcfd, which is 0.9 bcfd more than the February STEO forecast. The higher forecast largely reflects higher forecast crude oil prices, which EIA expects will contribute to more associated natural gas production.
In February, US LNG exports averaged 7.5 bcfd, a 2.3 bcfd (23%) decline from January. LNG exports were affected by the logistical constraints associated with suspending piloting services on several days at some US LNG export ports located in the Gulf of Mexico because of inclement weather. In addition, several US LNG export facilities (including Freeport, Cameron, and Corpus Christi) experienced lower natural gas feedstock supply in mid-February following declines in natural gas production because of extremely cold weather. EIA expects US LNG exports to continue their seasonal decline from March through May, averaging 7.8 bcfd in this period.