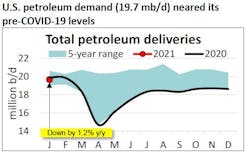
API: January US oil demand within 1.2% of year-ago level
US petroleum demand, as measured by total domestic petroleum deliveries, was 19.7 million b/d in January 2021, according to the latest monthly statistical report by the American Petroleum Institute (API), a 5.6% increase from December and a decrease of 1.2% compared with January 2020—a notable recovery given the depths of the 2020 COVID-19 recession.
Consumer gasoline demand, measured by motor gasoline deliveries, was 7.8 million b/d in January – basically steady from December (-0.1% m/m). Notably, this was the closest that January monthly gasoline demand was to that of December since 1957. The implication is that the majority of recent driving activity was likely borne out of necessity, as opposed to discretionary travel that could have produced the greater seasonal variation that we have historically observed. However, the 7.8 million b/d in January 2021 was still a decrease of 10.7% (900,000 b/d) versus January 2020. High-frequency mobility indicators, such as those from Apple and Google, also suggested that driving activity remained relatively weak in January.
In January, distillate deliveries of 4 million b/d rose by 14.2% from December and 0.5% y/y. Consequently, distillate demand exceeded its pre-COVID-19 level and also was consistent with the continued shift to e-commerce and home deliveries, furthered by the pandemic. Consistent with this, the DAT iQ industry trendlines showed that spot trucking and flatbed loads, van and reefer rates each increased year-on-year in January.
Jet fuel deliveries were 1.2 million b/d in January, which was an unusually mild seasonal decrease of 2.3% from December but 27.9% below the level of January 2020. This was consistent with high-frequency data from Flightradar24 that showed a drop-off in flights from December as well as a continued gap versus activity in January 2020.
US oil production
In January, US crude oil production was 11.1 million b/d, a 0.3% (100,000 b/d) m/m increase with solid productivity gains and increased drilling activity. Specifically, Baker Hughes reported 287 active oil-directed rigs in January, a 10% m/m increase (but 57% below the 671 rigs in January 2020). However, oil-directed rig productivity has achieved and held at record levels in most producing basins per EIA. By comparison, natural gas-directed drilling in January rose by 8% m/m but remained down 27% y/y. Similar to oil, natural gas productivity supported marketed production of about 103 bcf/d in January per EIA, which corresponded with the extraction of 5.1 million b/d of natural gas liquids (NGL) by API estimates. These figures reflected solid NGL demand coupled with a firming of NGL prices due to winter propane demand, increased petrochemical activity, and higher prices for crude oil and therefore natural gasoline.
International trade, refining
Driven by a combination of relatively strong exports and weak imports, the US was a petroleum net exporter in January for the 7th consecutive month. The US imported 5.5 million b/d of crude oil and 2.3 million b/d of refined products in January – the lowest petroleum imports for the month since 1992. Meanwhile, the US exported 3.0 million b/d of crude oil and 5.2 million b/d of refined products in January. These were respective decreases of 3.5% m/m for crude oil and 0.3% m/m for refined products.
US refinery throughput was 15.1 million b/d in January, a 3.3% m/m increase but a decrease of 10.6% y/y. This implied a capacity utilization rate of 82.0% for the month, which rose by 2.7 points from December but was the lowest monthly value since 2010.
