OGJ150 group’s earnings surged in 2018 on higher crude oil prices
The OGJ150 group reported a surge in earnings for 2018, thanks to higher commodity prices. Companies with a more liquids-weighted portfolio benefited most.
The group’s combined net income was $63.5 billion in 2018 compared with $34.37 billion in 2017. The group’s total revenue increased to $677.24 billion in 2018 from $561.74 billion in 2017.
The companies’ total assets at yearend 2018 were $1,209.83 billion, up from $1,198 billion at yearend 2017.
Capital and exploratory expenditures of the OGJ150 group increased nearly 30% to $122 billion. The group’s US and worldwide liquids and gas reserves as well as production all increased strongly in 2018.
To qualify for the OGJ150, oil and gas producers must be US headquartered, publicly traded, and hold oil or gas reserves in the US. Companies appearing on the list are ranked by total assets but are also ranked by revenue, stockholders’ equity, capital expenditures, earnings, production, reserves, and US net wells drilled.
Comparisons between totals for one year’s OGJ150 listing with those for another year consider company changes that may occur. But for any given year, the OGJ150 list does represent a substantial part of the US oil and gas industry and therefore accurately reflects trends in industry activity and financial performances.
As always, data for this year’s list reflect the prior year’s operations.
Market snapshot
During 2018, Brent crude prices averaged $71.34/bbl, an increase of 31% compared with $54.12/bbl in 2017. West Texas Intermediate crude prices averaged $65.23/bbl in 2018 compared with $50.80/bbl in 2017 and $43.29/bbl in 2016. Crude oil prices improved year-over-year on slower growth in global oil production and robust growth in global oil demand.
Crude oil prices exhibited greater volatility in 2018 despite an improvement in prices. During the year, Brent fluctuated from a yearly high of $86/bbl in early October to end the year at $50/bbl as the global oil market turned from being tight to being oversupplied.
Due to a lack of pipeline capacity coupled with increasing supply from western Canada, the Western Canada Select (WCS) crude oil price at Hardisty remained flat in 2018 compared with 2017 at about $39/bbl.
Spurred by higher oil prices, US crude oil production increased 17% in 2018, setting a record of nearly 11 million b/d. Production in the Permian basin of West Texas and eastern New Mexico contributed to most of this growth. The US also produced 4.35 million b/d of natural gas liquids in 2018, up from 3.78 million b/d of NGLs in 2017.
Natural gas prices at Henry Hub averaged $3.15/MMbtu in 2018 compared with $2.99/MMbtu in 2017 and $2.52/MMbtu in 2016. Despite record-high US gas production, prices remained relatively flat year-over-year as relatively low inventories and strong demand offset production growth.
US dry gas production increased 12% in 2018 to 28.5 bcfd, reaching a new record high for the second year in a row. Growth in LNG exports has supported increases in US gas production.
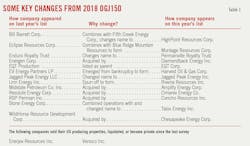
Changes in the group
The OGJ150 group now contains 113 companies compared with 128 companies in the compilation a year ago.
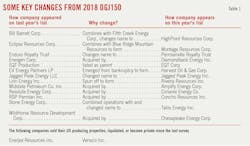
Seventeen companies listed last year dropped from the list this year due to acquisitions, liquidation, and other reasons.
Besides the changes recorded in Table 1, other changes of the group include the removal of Armada Oil Inc., Escalera Resources Co., United American Petroleum Corp., ZaZa Energy Corp., GeoPetro Resources Co., and TN-K Energy Group Inc. from the listing as they terminated their registrations to the US Securities and Exchange Commission or have had no recent filings.
EnerJex Resources Inc. sold their oil and gas properties. Rex Energy Corp. was acquired by PennEnergy Resources and become private. Venoco Inc. liquidated it assets. Newfield Exploration Co. was acquired by Encana Corp., a Canadian-based firm.
This year’s list contains two new companies that were not on the list in previous years. These are Roan Resources Inc. and Petro River Oil Corp.
Five companies on this year’s list are publicly traded limited partnerships compared with 7 such companies on the 2017 list. The largest LP this year is Black Stone Minerals LP with total assets of $1.75 billion. Kinder Morgan Inc., the former largest LP, was dropped from the list because the company does not disclose reserves and production, saying they are insignificant to their operations. The smallest LP on the list, Apache Offshore Investment Partners, had assets of $9.36 million.
There are seven royalty trusts listed this year, the same as the year before.
Seneca Resources Co. LLC is the only company that is a subsidiary of non-US energy companies or of companies operating mainly in another industry. EQT Corp. is now listed as a parent company. Kinder Morgan was removed for reasons already mentioned. Wexpro Co. also was removed because data is not disclosed in Dominion Energy’s 10-K.
The smallest company on this year’s list, Daybreak Oil & Gas Inc., has yearend 2018 assets of $1 million.
Group financial performance
Supported by higher commodity prices, the OGJ150 group reported a combined net income of $63.5 billion for 2018. This compares with a combined net income of $34.37 billion for 2017 and a combined net loss of $40 billion for 2016.
The group’s collective revenues increased 20% in 2018 to $677.24 billion. The group’s revenues totaled $561.7 billion in 2017.
Total assets at yearend 2018 totaled $1,209.83 billion for this year’s OGJ150 group compared with $1,198.11 billion a year ago for the same group.
Seventy-four companies in the OGJ150 posted a profit in 2018, compared with 77 such companies in 2017 and 18 companies in 2016. There were 42 companies posting net income of more than $100 million in 2018 compared with 38 such companies in 2017 and 7 companies in 2016.
A total of 33 companies on the OGJ150 list posted a net loss for 2018. This compares with 51 such companies in 2017 and 97 in 2016. In 2018, 10 of the OGJ150 companies had a net loss exceeding $100 million compared with 19 such companies in 2017 and 108 in 2016.
Total stockholders’ equity of the group increased 4.6% from a year ago to $641.25 billion in 2018. Capital and exploration spending of the group increased 27.8% to $122 billion.
Return on assets for the OGJ150 group jumped to 5.2% in 2018 from 2.8% in 2017 and -3.4% in 2016.
Return on revenues for the OGJ150 group jumped to 9.4% in 2018 from 6.1% in 2017 and -8.6% in 2016.
Group operations
The OGJ150 group’s worldwide liquids production increased 7.6% to 3.62 billion bbl in 2018. The group’s US liquids production rose 15% to 2.42 billion bbl.
By yearend 2018, the group’s worldwide liquids reserves increased 16.8% to 46.12 billion bbl. The group’s US liquids reserves increased 14.36% to 30.27 billion bbl. US liquids reserves accounted for 65.6% of their worldwide liquids reserves.
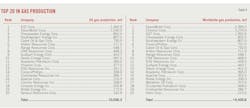
Worldwide gas production for this year’s OGJ150 group increased 6.5% to 17.65 tcf in 2018. The group’s gas production in the US increased 8.58% to 12.89 tcf.
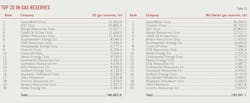
The group’s US gas reserves increased 6% to 181.72 tcf. On a worldwide basis, the group’s gas reserves increased 4% to 233.67 tcf. US gas reserves accounted for 78% of worldwide gas reserves.
The group’s total US net wells drilled increased to 8,779 in 2018 from 7,664 in 2017 and 5,745 in 2016.
Top 20 by assets
Based on assets, ExxonMobil Corp. again holds the top spot, reporting $346.19 billion in assets at yearend 2018 compared with $348.69 billion at yearend 2017 and $330.3 billion at yearend 2016. It is followed by Chevron Corp., ConocoPhillips, Occidental Petroleum Corp., and Anadarko Petroleum Corp. Oxy in August completed its acquisition of Anadarko in a transaction valued at $55 billion (OGJ Online, Aug. 8, 2019).
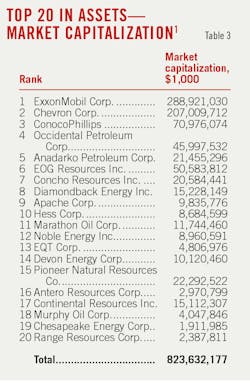
Concho Resources Inc., which ranked No. 16 by assets a year earlier, moved to No. 7 in 2018, doubling its assets to $26.29 billion from $13.73 billion in 2017. In February 2018, the company closed on an acquisition of producing wells with 5,000 boe/d and 21,000 net acres, mainly in the Midland basin.
Diamondback Energy Inc. moved to No. 8 on this year’s list from No. 23 a year earlier. Its total assets at yearend 2018 surged to $21.59 billion from $7.77 billion at yearend 2017. Diamondback acquired Energen Corp. in 2018.
Devon Energy Corp.’s total assets declined to $19.5 billion at yearend 2018 from $30.24 billion at yearend 2017. During 2018, the company sold its midstream business and certain noncore upstream assets, generating nearly $5 billion in proceeds. With an intent to focus on its core US oil plays, the company continued to separate their Canadian business this year.
The top 20 companies had total assets of $1,042 billion at yearend 2018, representing 86% of the entire group’s assets. This compares with $1,040 billion for the top 20 a year ago, which then accounted for 87% of the group’s total.
The top 20 by assets received revenues of $624.44 billion in 2018, up from $523.37 billion in 2017. These firms posted 2018 net income of $65.86 billion compared with combined earnings of $29.23 billion in 2017. In 2018, revenues and net income for the top 20 companies were 92.2% and 97.1% of the total group, respectively. A year ago, these percentages were a respective 93.2% and 85%.
US liquids production of the top 20 by assets increased 15.45% in 2018 to 1.77 billion bbl. Their liquids production worldwide increased 6.3% to 2.97 billion bbl.
The top 20’s gas production increased 9.2% in the US and 6.09% worldwide year-over-year.
The top 20’s liquids reserves climbed 16.28% in the the US and 18.54% worldwide. The group’s gas reserves also increased both in US and worldwide, up 6.52% and 3.68%, respectively.
Capital and exploratory expenditures in 2018 by the top 20 totaled $91.07 billion, up from $72.1 billion in 2017. Capital expenditures of the top 20 amounted to 74.64% of the OGJ150 total in 2018, down from 75.5% a year earlier.
The top 20 companies drilled 5,410 US net wells in 2018 compared with 4,433 drilled in 2017 and accounting for 62% of US net wells drilled by the whole OGJ150 group. This is up from 57.8% in 2017. Companies outside the top 20 drilled 3,369 US net wells in 2018, 138 more than in 2017.
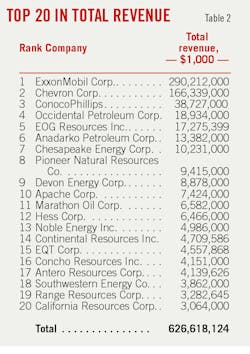
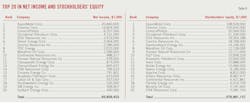
Earning leaders
ExxonMobil, Chevron, and ConocoPhillips reported the highest earnings for 2018 among this year’s OGJ150 group.
ExxonMobil and Chevron reported 2018 earnings of $20.8 billion and $14.82 billion, respectively, up from $19.7 billion and $9.19 billion a year ago.
ConocoPhillips’ profits totaled $6.25 billion in 2018 compared with a net loss of $855 million in 2017. The increase was mainly due to higher realized commodity prices and the absence of $6.6 billion in impairments.
Marathon Oil Corp. recorded a net income of $1.1 billion for 2018 compared with a net loss of $5.7 billion in 2017. The company’s revenues increased 39% compared with 2017 as a result of increased price realizations and net sales volumes. At the same time, exploration and impairment expenses decreased year-over-year.
EQT, ranked No. 16 on last year’s list, was not included on this year’s list. The company reported a net loss from continuing operations of $2.4 billion compared with a net income from continuing operations of $1.4 billion in 2017. The decrease was primarily attributable to impairments of $3.5 billion and losses on the sale of long-lived assets.
Antero Resources Corp., off this year’s list but ranked as No. 15 last year, reported a net loss of $397.5 million for 2018 compared with net earnings of $615 million a year ago. The loss was mainly due to commodity-derivative losses and impairments.
The collective net income of this year’s top 20 earners was $65.86 billion compared with $47.2 billion for the prior year’s top 20.
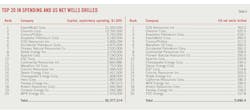
ExxonMobil leads the OGJ150 group in capital spending. The company’s capital spending increased to $21 billion from $17.2 billion a year ago. ExxonMobil’s upstream investments in 2018 included growth in the Permian basin, acreage acquisitions in Brazil, and global development projects.
Chevron was second, with $13.79 billion in expenditures, followed by ConocoPhillips, Anadarko, EOG Resources Inc., and Oxy.
The collective outlays of the top 20 capital spending leaders totaled $92.38 billion compared with the previous top 20’s spending of $74.69 billion recorded in 2017.
The top 20 companies in number of US net wells drilled reported 5,690 net wells for 2017, up from 4,703 in 2017, thanks to higher commodity prices.
EOG Resources again led the group in the number of US net wells drilled, drilling 760 wells. The company also led the group for its number of net wells drilled in the US during 2017, with a count of 525.
In 2018, EOG Resources completed 304 net Eagle Ford wells and continued to test the Austin Chalk play concept with the completion of 27 net Austin Chalk wells. In the Permian basin, EOG Resources completed 265 net wells during 2018, primarily in the Delaware basin, Wolfcamp shale, Bone Spring, and Leonard plays.
Chevron drilled 525 net wells in the US in 2018 compared with 447 a year earlier and is the second company on the current list.
Anadarko drilled 418 net wells, ranked at No. 3 and up from 371 wells drilled in 2017. ConocoPhillips drilled 317 US net wells in 2018, up from 186 in 2017.
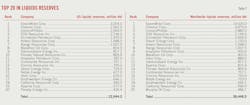
Liquids reserves, production leaders
As usual, ExxonMobil, Chevron, and ConocoPhillips top the OGJ150 group in worldwide liquids production and reserves. EOG Resources is ranked fourth in worldwide liquids reserves, and Oxy ranks fourth in worldwide liquids production.
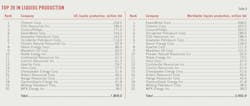
ExxonMobil’s worldwide liquids reserves increased to 14 billion bbl from 10.3 billion bbl a year ago. During 2018, the company continued to have exploration success in Guyana and made strategic acreage acquisitions in Mozambique, Brazil, Papua New Guinea, and US tight oil.
ExxonMobil produced 698 million bbl of oil worldwide in 2018, down slightly from 700 million bbl a year ago.
ExxonMobil’s liquids reserves in the US increased to 3.2 billion bbl from 2.7 billion bbl a year ago, topping the group again and followed by Chevron, ConocoPhillips, and EOG Resources.
Chevron’s liquids reserves in the US increased to 2.4 billion bbl in 2018 from 1.9 billion bbl a year earlier. Its international liquids reserves increased to 3 billion bbl from 2 billion bbl.
With 224 million bbl of output, Chevron continued to produce the most liquids in the US during 2018, followed by EOG Resources, ConocoPhillips, ExxonMobil, and Anadarko.
Gas reserves, production leaders
The company with the most worldwide gas reserves in 2018 is ExxonMobil, followed by Chevron, EQT, Range Resources, Cabot Oil & Gas Corp., and Antero Resources.
ExxonMobil’s worldwide gas reserves increased to 36.35 tcf in 2018 from 33.6 tcf in 2017.
Southwestern Energy Co., which ranked fourth last year on this list, moved down to No. 7, with its global gas reserves down from 11.126 tcf to 8 tcf, primarily due to the sale of the Fayetteville shale exploration and production assets.
Range Resources Corp.’s worldwide gas reserves increased to 12 tcf in 2018 from 10.26 tcf in 2017. Cabot Oil & Gas’s worldwide gas reserves increased to 11.6 tcf in 2018 from 9.35 tcf in 2017. All of their gas reserves are in the US.
Chesapeake Energy Corp.’s worldwide gas reserves decreased to 6.77 tcf in 2018 from 8.6 tcf in 2017. In 2018, the company sold all its net acres in the Utica shale area in Ohio along with related property and equipment to Encino.
Following ExxonMobil in worldwide gas production are Chevron, EQT, Chesapeake Energy, and Southwestern Energy.
ExxonMobil leads the group in US gas reserves this year, followed by EQT, Range Resources, and Cabot Oil & Gas. ExxonMobil’s gas reserves in the US increased to 21.4 tcf in 2018 from $19.83 tcf a year ago.
First in US gas production for 2018 is EQT, followed by ExxonMobil, Chesapeake, Southwestern Energy, and Cabot Oil & Gas.
EQT’s gas production surged to 1,393 bcf in 2018 from 795 bcf in 2017. Its proved gas reserves also increased by 1 tcf in 2018.
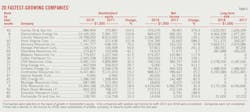
20 fast-growing companies
The ranking for the OGJ150 list of the fastest-growing companies is based on growth in stockholders’ equity. Other qualifications are that companies are required to have positive net incomes for both 2017 and 2018 and have an increase in net income in 2018. Subsidiary companies, newly public companies, and LPs are not included.
Carrizo Oil & Gas Inc. led the list this year. Its stockholders’ equity rose to $981 million from $371 million a year ago, and its net income increased to $376 million in 2018 from $78.46 million in 2017. The company ranked No. 40 in the group by assets.
Diamondback Energy was ranked second on the list and No. 8 by total assets. The company’s stockholders’ equity increased to $14.16 billion in 2018 from $5.58 billion a year ago. Its net income increased to $845.67 million in 2018 from $482.26 million in 2017.
About the Author

Conglin Xu
Managing Editor-Economics
Conglin Xu, Managing Editor-Economics, covers worldwide oil and gas market developments and macroeconomic factors, conducts analytical economic and financial research, generates estimates and forecasts, and compiles production and reserves statistics for Oil & Gas Journal. She joined OGJ in 2012 as Senior Economics Editor.
Xu holds a PhD in International Economics from the University of California at Santa Cruz. She was a Short-term Consultant at the World Bank and Summer Intern at the International Monetary Fund.

Laura Bell-Hammer
Statistics Editor
Laura Bell-Hammer is the Statistics Editor for Oil & Gas Journal, where she has led the publication’s global data coverage and analytical reporting for more than three decades. She previously served as OGJ’s Survey Editor and had contributed to Oil & Gas Financial Journal before publication ceased in 2017. Before joining OGJ, she developed her industry foundation at Vintage Petroleum in Tulsa. Laura is a graduate of Oklahoma State University with a Bachelor of Science in Business Administration.