US refiners continue consolidation, restructuring efforts
William L. Leffler
Venus Consulting
Houston
Our previous installment on US refining industry concentration examined how frenzied mergers, acquisitions, other partnerships, and shutdowns that occurred from 1995 to 2005 consolidated the industry (OGJ, June 4, 2007, p. 22). The consolidation, however, didn't result in any one company gaining appreciable market power, whether viewed on a regional or nationwide basis.
In addition to examining further consolidation and realignment actions by US refiners since 2005, this next installment extends the original 2007 analysis, which measured refining capacity based on distillation capability, to include complexity, which measures a refinery's ability to produce higher-valued products (e.g., more light oils, less residual fuel). The extended analysis is based on suggestions from industry observers that complexity, perhaps, is a better gauge of capacity. This article presents a corresponding two-tiered examination of US refining capacity, further changes over time, and different ways to measure them.
Consolidation, realignment
As previously reported, between 1995 and 2005, the top 25 US refining companies, each of which had capacities exceeding 200,000 b/d, were transformed in one fashion or another to 14.
Venerable names in the refining industry, such as Arco, Texaco, Unocal, and Diamond Shamrock disappeared, joining others like Gulf Oil, Sohio, and Signal. While no new grassroots refineries were built, additions to existing refineries and debottlenecking projects resulted in a 1.9 million b/d rise in total refining capacity by 2007.
The US refining landscape continued to evolve through 2015 amid restructuring. While new names emerged, others disappeared altogether, such as Sunoco Inc., which sold off its refining assets in pieces (OGJ Online, Sept. 6, 2011).
The larger 2007-15 refinery transactions include the following:
• Philadelphia Energy Solutions took over Sunoco's Philadelphia refinery.
• PBF Holding Co. LLC (PBF), Parsippany, NJ, bought Sunoco's Toledo, Ohio, refinery (OGJ Online, March 1, 2011), as well as Valero Energy Corp's Delaware City, Del., refinery and Paulsboro, NJ, refinery (OGJ Online, Jun. 2, 2010; Sept. 27, 2010).
• ConocoPhillips separated its refining and marketing businesses in a spinoff to create standalone, downstream company Phillips 66 (OGJ Online, Nov. 10, 2011; July 14, 2011).
• LyondellBasell bought Citgo's interests in Houston Refining LP's 268,000-b/d refinery located at the city limits of Houston and Pasadena, Tex., along the Houston Ship Channel (OGJ Online, July 17, 2007; Aug. 17, 2006).
• Alon USA Energy Inc., Dallas, purchased Valero's refinery in Krotz Springs, La. (OGJ Online, July 8, 2008), as well as Paramount Petroleum Corp., which included Paramount's refinery in Paramount, Calif. (OGJ, Dec. 18, 2006, p. 56).
• Husky Energy Inc. acquired a 50% interest in BP PLC's Toledo, Ohio, refinery (OGJ Online, Dec. 5, 2007).
• Calumet Specialty Produces Partners LP, Indianapolis, bought Montana Refining Co. Inc., which operates a small heavy-oil refinery in Great Falls, Mont. (OGJ Online, Aug. 15, 2012), as well as NuStar Energy LP's San Antonio refinery (OGJ, Dec. 2, 2013, p. 34).
• Marathon Petroleum Corp. completed the purchase of BP's refinery at Texas City, Tex., renaming it Galveston Bay Refinery (OGJ Online, Feb. 1, 2013; Oct. 8, 2012).
• Tesoro Corp. bought BP's Carson refinery near Los Angeles (OGJ Online, June 3, 2013) and sold its Kapolei, Ha., refinery to Par Petroleum Corp (OGJ Online, Sept. 27, 2013; Jan. 9, 2013).
• Monroe Energy LLC, a subsidiary of Delta Air Lines Inc., purchased Phillips 66's refinery in Trainer, Pa. (OGJ Online, May 1, 2012).
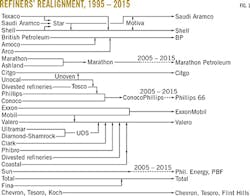
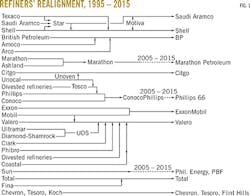
Fig. 1, updated from the previous article, shows the realignment of US refiners between 1995 and 2015. Several companies have been combined or separated, depending on the joint-venture arrangements of their owners.
Structural changes that occurred over the past 10 years have been minor compared with those that took place during the previous decade. As Fig. 1 shows, the only major structural change to take place since 2007 has been Sunoco's breakup, with the other transactions resulting in just a few changes in ownership.
Despite the reduced frequency of downstream mergers and acquisitions from 2007 to 2015, the list of companies with more than 200,000 b/d in refining capacity has expanded to 23, collectively managing 86% of total US capacity.
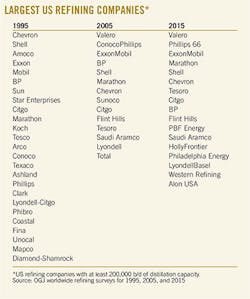
Table 1, taken from OGJ refinery surveys, provides a recap of the largest refiners (those with more than 200,000 b/d of capacity) in 1995, 2005, and 2015.
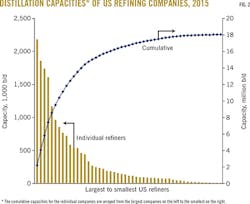
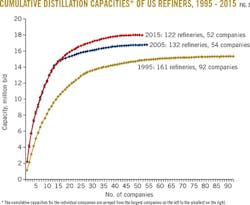
Fig. 2 shows the array of refining companies, from the largest to smallest, for 2015, as measured by distillation capacity. It includes the so-called creaming curve, which shows aggregated, or cumulative, capacities as a function of the number of refiners, again from largest to smallest. Beyond those companies, the creaming curve bends as a larger number of smaller refiners (another 30-35) add little to total US capacity.
Concentration, control
The 2007 analysis considered whether concentration and market power that had emerged by 2005 presented antitrust issues for the US refining industry. It concluded that, with so many refineries across the US at the time, the industry was under little risk of broad legal challenge based on its structure.
After 10 years of additional structural change, most of which has involved asset shuffling to further dilute ownership concentration, even less concern is warranted.
Fig. 3 shows the creaming curves for 1995, 2005, and 2015, indicating that aggregate US refining companies' capacities have increased substantially in 20 years.
As expansions were commissioned, total US refining capacity increased by 2015 to 18.0 million b/d from 16.7 million in 2005, which had increased from 15.4 million b/d in 1995.
A closer look at the plots in Fig. 3 reveals the following:
• In 1995, 23 refiners held 80% of refining capacity.
• In 2005, 12 refiners held 80% of refining capacity.
• By 2015, the number of companies holding 80% of the capacity has increased to 17.
Distillation, complexity
While distillation size tells a great deal about a refinery's overall capacity, it doesn't include everything. Operators invest sizeable resources and capital into technology downstream of distillation units.
The ability of a refinery to convert heavier, less-desirable streams into high-value products can be measured using complexity factors. (See accompanying box.)
When pricing for light-end products (e.g., gasoline, kerosene, jet fuel, distillates) is $15-20/bbl higher than pricing for heavier-end products (e.g., residual fuel), or light crude (e.g., West Texas Intermediate or Light Louisiana Sweet) prices are $5-8/bbl over heavy crudes (e.g., Mexican Maya or Western Canadian Select), refineries with more complex configurations have an appreciable advantage over refineries with more limited processing capabilities.
Since 1995, US refiners added some 240,000 b/d of coking capacity, increasing their ability to convert heavier crude bottoms into lighter products. Catalytic cracking and hydrocracking capacities also collectively increased by 210,000 b/d.
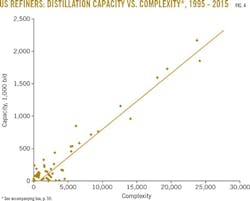
Fig. 4 shows the evolution of US refineries' distillation capacities vs. their complexity ratings between 1995 and 2015.
Close examination of Fig. 4 shows:
• Distillation capacity has a 94% correlation with complexity, suggesting little justification exists for using one in lieu of the other to determine concentration.
• A small number of very large refiners have both large distillation capacities and disproportianately high levels of complexity.
• Other large refiners have matched distillation capacity and complexity but on a smaller scale.
• A large number of smaller refiners contribute only a small volume to the industry's total conversion capacity, which has been the case for the last 20 years.
COMPLEXITY
Analysts use complexity factors in several ways. Evaluating the market value of a refinery needs to take into account the value and cost of processing units downstream of the distillation unit. Evaluating the operating cost-competitiveness of a refinery compared to other refineries in benchmarking studies (as Solomon Associates does) needs metrics to compare both size and capital costs of technology.
Complexity factors have been explained by Daniel Johnson in the Oil & Gas Journal (OGJ, March 18, 1996, p. 74). Johnson points out that complexity factors take into account the capital cost/bbl of capacity for every unit in a refinery relative to its distillation capacity cost/bbl.
The capital cost/bbl of a vacuum distillation unit might be 1.3 times that of an atmospheric distillation unit's cost/bbl but only have one-third of the throughput. The capital cost/bbl of a catalytic cracker or coker might be 5 or 8 times the capital cost/bbl of a distillation unit. These cost factors are continually updated by OGJ and by others who use their own factors.
The complexity of a refinery is a weighted average, or the sum of each unit's throughput multiplied by the relative complexity factor of each (with distillation complexity = 1).
Valero Corp.'s Houston refinery, for example, has a 97,000-b/d distillation unit, as well as capacities for vacuum distillation, catalytic cracking, alkylation, hydrocracking, and hydrotreating, for a complexity factor of 1.268 million b/d (complexity factor of each unit times its throughput capacity).
Suncor Energy Inc.'s refinery in Commerce City, Colo., has a 98,000-b/d distillation unit, plus capacities for vacuum distillation, catalytic reforming, catalytic cracking, dimerization, and some hydrotreating for a complexity factor of only 0.753 million b/d.
The author