Drilling slump, lower prices stymie midstream growth
Dan Lippe
Petral Consulting Co.
Houston
Three 2015 developments will be of particular importance to US midstream companies over the next 18-24 months.
Midyear statistics from the US Energy Information Administration (EIA) confirmed, for the first time, that the collapse in rig counts would translate into slower growth in US crude oil production, and perhaps, even reverse the production surge that began in fourth-quarter 2011.
Secondly, crude oil traders acknowledged Iran's imminent return to full production, with bearish consequences for crude prices.
Lastly, China's currency devaluations in August caused turmoil in global financial markets, and crude oil traders immediately accounted for the bearish implications of the current era of slower growth for the Chinese economy.
The second and third factors combined to spark a 12-14% decline in global benchmark crude oil prices during mid-August, but spot prices rallied by 20-25% during the last 3 days of August, sustaining those levels during September.
Developments in chemical feedstock markets, however, provided some good news to NGL marketers. Dow Chemical Co. announced it will start up its new propane dehydrogenation (PDH) plant at Freeport, Tex., in fourth-quarter 2015, while Enterprise Products Partners LP. said it plans to commission its new PDH plant at Mont Belvieu, Tex., sometime in first-half 2016 (OGJ, Sept. 7, 2015, p. 96). When these two PDH plants ramp up to full-capacity, they will increase domestic chemical feedstock demand by 50,000 b/d.
NGL raw-mix production
Gas plant NGL production is the primary driver for most of the midstream industry's infrastructure expansion projects. Growth in crude oil production and resulting increases in associated gas production have been, and will remain, the primary drivers for gas-plant NGL production trends.
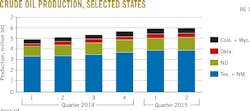
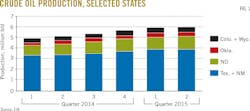
EIA statistics showed annual growth in US crude production was 1.30 million b/d in fourth-quarter 2014 but slowed to 1.26 million b/d in first-quarter 2015 and 0.99 million b/d in the second quarter. The pattern of sluggish growth in second-quarter 2015 will persist for second-half 2015.
Table 1 summarizes quarterly trends in US crude oil production.
Petral Consulting Co. (PCC) estimates associated gas production in the six core states during first-half 2015 increased to 13.5 bcfd from 12.3 bcfd in second-half 2014. Annual growth in associated gas production for first-half 2015 was about 2.5 bcfd.
As year-over-year growth in US crude production continues to slow in second-half 2015, Petral Consulting forecasts associated natural gas production will increase by only 1 bcfd compared with second-half 2014.
Regional trends in NGL raw mix production
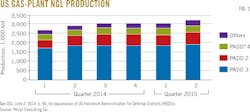
US gas plant NGL production continued to increase in 2015. In second-quarter 2015, gas plant NGL production rose to 3.28 million b/d from 3.09 million b/d during first-quarter 2015, according to EIA data.
While first-quarter 2015 production was 130,600 b/d higher compared with the same period in 2014, production during the second quarter was up by just 74,800 b/d vs. second-quarter 2014.
If all gas plants had operated in full ethane-recovery mode, total US gas plant NGL production would have increased to 3.4-3.5 million b/d in late 2014.
NGL production from gas plants in the US Midcontinent during first-half 2015 increased at historic rates, led by production from new gas plants in the Utica formation in eastern Ohio.
Production during the first 6 months of 2015 was up by 154,400 b/d from the same period in 2014. Midcontinent production during first-half 2015 accounted for 44.3% of total US production growth.
Production from gas plants in the Marcellus shale slowed during first-half 2015 but still averaged 94,200 b/d higher vs. first-half 2014. Compared with second-half 2014, year-over-year growth for first-half 2015 was up 121,900 b/d.
Total NGL production in the northeast US remained below 300,000 b/d and less than in all other production regions except the West Coast (Fig. 2).
C2 rejection, NGL raw mix production
Spot prices for purity ethane and ethane-propane mix in Mont Belvieu have been too weak to support full ethane recovery since second-quarter 2012 and continued to decline through year-end 2014. Spot prices in Mont Belvieu fell below 20¢/gal in December 2014 and remained at 17-19¢/gal during first-half 2015. With recovery margins well below breakeven levels, ethane rejection is widespread and occurs in all producing regions.
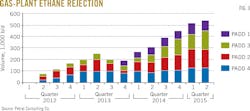
Petral Consulting estimates ethane rejection increased to 501,300 b/d in first-quarter 2015 and 538,100 b/d in second-quarter 2015 compared with 443,200 b/d in fourth-quarter 2014. Petral Consulting also estimates rejection will increase to 570,000-590,000 b/d in second-half 2015 (Fig. 3).
If gas processors had operated all gas plants at full ethane-recovery mode, total US NGL production would have been 3.5 million b/d in second-half 2014 and 3.6-3.8 million b/d during first-quarter 2015.
Beginning in mid to late-2016, petrochemical companies will complete construction of several new ethylene plants (OGJ, July 6, 2015, p. 74). Enterprise Products will also complete its ethane export terminal at Morgan's Point next year (OGJ, June 6, 2015, p. 79). US demand for ethane will increase by 500,000 b/d during the next 2 years, while US ethane exports will ramp up to 100,000-200,000 b/d. By mid to late 2017, most-perhaps all-US gas plants will be required to operate in full ethane recovery.
NGL market overview
Three markets account for more than 90% of US NGL demand:
• Petrochemical feedstock.
• Gasoline blending.
• Retail space heating and internal combustion.
All five NGL components are used as feedstock in petrochemical production, and normal butane, isobutene, and natural gasoline are used in gasoline blending. Retail space heating and internal combustion-engine markets, however, consume only propane. Of the three primary domestic end use markets, only the petrochemical industry has the potential to considerably increase domestic NGL consumption. Construction of 12-15 billion lb/year of new ethylene capacity based on purity-ethane feedstock will drive NGL demand in the petrochemical industry.
The petrochemical industry is the largest of the midstream industry's three domestic end-use markets. Petral Consulting estimates ethylene feedstock demand by direct contact with ethylene producers. Other segments of the petrochemical industry include propane dehydrogenation (propane), methyl tertiary butyl ether (MTBE; normal butane and isobutane), and propylene oxide (isobutane).
NGL demand in the ethylene feedstock market was 1.52 million b/d in first-quarter 2015 but increased to 1.56 million b/d in second-quarter 2015. Demand in first-quarter 2015 was 25,900 b/d more than in first-quarter 2014. Year-to-year growth in demand, however, jumped to 126,500 b/d in second-quarter 2015. Demand for NGL feedstock increased during first-half 2015 because these feeds continued to provide ethylene producers with lower production costs vs. refinery naphtha and gas oil.
Ethane accounted for 68.3% of ethylene industry NGL feedstock demand in first-quarter 2015 and 69.6% in second-quarter 2015. During first-quarter 2015, ethylene producers took three plants out of service for planned maintenance, causing ethane demand to drop to 1.035 million b/d. In second-quarter 2015, ethane demand rebounded to 1.085 million b/d.
Demand for LPG feeds (propane and normal butane) was 453,600 b/d in first-quarter 2015 and 445,600 b/d in second-quarter 2015. LPG feeds accounted for 29.9% of total NGL feedstock demand in first-quarter 2015 and 28.6% in the second quarter (Table 3).
Gasoline blending demand
The refining industry is the second largest industrial-commercial market for NGLs. As is true for propane demand in retail markets, refinery demand for normal butane is strongly seasonal. But demand for isobutane and natural gasoline is only moderately seasonal.
Refinery demand for normal butane reaches its seasonal peak November through January, while refinery demand for isobutane and natural gasoline is usually at its seasonal peak in May through August. The counter-cyclical nature of refinery demand for isobutane and natural gasoline offsets some of the strongly seasonal demand for normal butane.
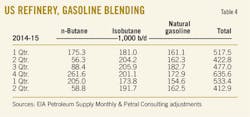
EIA statistics for refinery inputs show demand for butanes and natural gasoline was 533,400 b/d in first-quarter 2015 but fell to 412,900 b/d in the second quarter.
According to EIA statistics, refinery inputs of gas plant normal butane were 205,000 b/d in first-quarter 2015, up by 29,500 b/d compared with first-quarter 2014. Refineries shifted to producing summer grade gasoline to comply with the seasonal reduction in maximum rvp, reducing refinery demand for gas plant normal butane to 58,800 b/d in second-quarter 2015. Refinery demand for normal butane in second-quarter 2015 remained about the same as in 2014 and accounted for 14.2% of total refinery demand for butanes and natural gasoline.
EIA statistics show refinery inputs of isobutane fell to a seasonal low of 173,800 b/d in first-quarter 2015, or 27,400 b/d lower than in fourth-quarter 2014. The decline in refinery demand for isobutane was due to the seasonal reduction in refinery crude runs and fluid catalytic cracker unit (FCCU) feed rates. As crude runs and FCCU rates increased, refinery isobutane demand recovered to 191,700 b/d in second-quarter 2015. Similarly, EIA statistics show refinery demand for natural gasoline fell to 154,600 b/d in first-quarter 2015 before rebounding to 162,300 b/d during the second quarter (Table 4).
Retail markets; NGL exports
Retail markets consume propane in four primary end-use segments:
• Residential, commercial, and resellers (space-heating markets).
• Agriculture.
• Motor fuel.
• Miscellaneous industrial.
Of these four segments, consumption in the residential-commercial sector typically accounts for 75-80% of total demand in the retail market. Petral Consulting estimates propane demand in all end-use sectors increased to 1 million b/d in first-quarter 2015.
Petral Consulting estimates retail propane demand during winter 2014 was 7 million bbl less than the 5-year average. Propane sales into retail markets always decline with warmer weather, and Petral Consulting estimates demand in second-quarter 2015 was 300,000-310,000 b/d.
Waterborne exports emerged as the most important growth-market outlet for US LPG supply in 2013, with exports of 428,300 b/d in fourth-quarter 2013 vs. 240,100 b/d in first-quarter 2014. Growth accelerated for the balance of 2014 and first-half 2015.
According to statistics published by US International Trade Commission (USITC), LPG exports were 549,200 b/d in second-half 2014, up by 164,700 b/d from second-half 2013. LPG exports jumped to 607,600 b/d in first-quarter 2015 and 690,000 b/d in second-quarter 2015. First-quarter 2015 LPG exports were 213,400 b/d more compared with the same period in 2014, while exports during the second quarter of 2015 increased by 193,800 b/d vs. second-quarter 2014.
USITC statistics showed NGL exports (LPG exports + ethane and natural gasoline exports) were 853,400 b/d in first-quarter 2015 and 924,100 b/d in second-quarter 2015. Total NGL exports during first-quarter 2015 were 269,100 b/d more than in first-quarter 2014, while second-quarter 2015 exports rose by 221,700 b/d from the same period in 2014.
The global market's finite capacity to absorb US exports of propane and butane, however, emerged as a constraint in first-half 2015. Specifically, propane exports reached a new record high of 661,400 b/d in February but averaged only 557,800 b/d in March through June 2015 before returning to 600,000 b/d or more only in April.
According to USITC statistics, LPG export terminals increased propane exports to 388,300 b/d in first-quarter 2015 and 455,500 b/d in second-quarter 2015. The record high for propane and butane exports from terminals in Customs District 59 (which includes the Houston-Galveston, Tex., district and Port Arthur, Tex., district) reached 493,600 b/d in December 2014. This record, however, lasted only 2 months, with propane exports jumping to 610,500 b/d in February 2015, when Sunoco Logistics Partners LP commissioned its terminal at Nederland, Tex.
The highlight of first-half 2015 was the surge in propane exports to markets in Northeast Asia. According to USITC, propane exports from the Houston-Galveston customs district to Northeast Asia were 148,200 b/d in first-quarter 2015 and 178,100 b/d in the second quarter. USITC statistics showed exports jumped to 266,800 b/d in July 2015 to make July the third month of the year in which exports to Northeast Asia were 200,000 b/d more. Exports to destinations in Northeast Asia and Europe increased at similar rates during 2014, but while exports to Asian markets continued to increase in first-half 2015, exports to Europe during the first 6 months of 2015 were 4,600 b/d lower compared with second-half 2014.
US butane exports increased during both the first and second quarters of 2015. Overall exports to all destinations were 65,900 b/d in first-quarter 2015, up by 9,000 b/d vs. fourth-quarter 2014. Exports during second-quarter 2015 were 103,000 b/d, 37,100 b/d higher than the previous quarter. Combined volumes of propane and butane exports from all US ports were 607,600 b/d in first-quarter 2015 and increased to 690,000 b/d in the second quarter. Exports in the first quarter were 213,400 b/d more than in the same period of 2014, while second-quarter 2015 exports increased by 193,800 b/d from second-quarter 2014.
Combined volumes of propane and butane exports from all US ports increased for the fourth and fifth consecutive quarters in the first and second quarters of 2015.
USITC statistics show propane exports to destinations in the Western Hemisphere were 267,300 b/d in first-quarter 2015 and accounted for 49.3% of total exports. Propane shipments to western hemisphere destinations increased to 307,800 b/d in second-quarter 2015 and were 52.4% of total exports. Exports to Europe in second-half 2014 varied within a range of 45,000-110,000 b/d and averaged 84,600 b/d in third-quarter 2014 and 89,000 b/d in fourth-quarter 2014.
Finally, the increase in terminal capacity in the Gulf Coast also supported growth in exports to destinations in Northeast Asia of 148,200 b/d in first-quarter 2015 and 185,200 b/d during the second quarter.
US ethane exports currently move exclusively to Canada. EIA statistics showed ethane exports were 64,600 b/d in first-quarter 2015 and increased to 70,000 b/d in the second quarter. Exports during the first quarter were 49,500 b/d more than first-quarter 2014, while second-quarter 2015 exports increased by 46,700 b/d from the same period last year. When Enterprise Products completes its ethane export terminal in the Houston Ship Channel in 2016, the US will begin to export ethane to ethylene producers in Europe and India.
Midstream infrastructure
NGL midstream companies build and operate four basic elements of infrastructure:
• Gas processing plants.
• Raw mix purity-product transportation systems.
• Fractionators.
• Storage.
The first three types of infrastructure operate 24hr/day, 365 days/year, while storage, the fourth element, is essential to manage the fundamentally and strongly seasonal nature of propane and normal butane demand.
The midstream industry historically focused all of its resources and management efforts on expanding capacity in the first three elements but made no investment in expanding NGL storage capacity and affiliated infrastructure. Storage infrastructure projects, consequently, are now the critical next phase of development for US midstream companies.
NGL inventory, storage
During 2008-14, the US midstream industry completed several major pipelines and numerous expansions of NGL fractionation capacity. All midstream companies, however, neglected to expand NGL storage capacity, the final piece of the infrastructure puzzle.
Based on aggregate storage capacity (salt caverns, aboveground tanks), total NGL storage capacity in the US is sufficient to meet industry requirements for many years to come. All spare capacity, however, is located along the Upper Texas Coast and in southern Louisiana. This leads markets with growing supply surpluses, particularly those in the Northeast and Upper Midwest, to incur substantial transportation costs to transfer seasonal surpluses to these storage sites. NGL marketers have also rediscovered the importance of brine pond capacity as the Mont Belvieu storage complex's significant constraint.
During 2001-2008, NGL inventory in primary storage never exceeded 160 million bbl. As gas plant NGL production increased at accelerating rates after 2010 and domestic demand reached practical maximums, however, NGL inventory began to grow.
NGL inventory in primary storage reached a seasonal peak of 191 million bbl in 2012 and 210 million bbl in 2014. In 2015, NGL inventory is on track to peak above 230 million bbl.
Regionally, NGL inventory in US midcontinent storage did not exceed 50 million bbl until 2009 and then increased to peaks of 58 million bbl in 2011, 60 million bbl in 2012, and 64 million bbl in 2014.
While NGL storage capacity remains constrained in both the Northeast and Midcontient, the US Gulf Coast, with more than 300 million bbl of capacity in salt caverns, has ample spare capacity.
During 2001-08, NGL inventory in Gulf Coast storage exceeded 100 million bbl only once (September 2005) but has exceeded 110 million bbl every year since 2012 and will probably reach a peak of 140-150 million bbl in 2015.
If midstream companies had expanded pipeline capacity to deliver the emerging surpluses in the Northeast as aggressively as they expanded capacity between the Midcontinent and Gulf Coast, storage capacity at the East Coast and Midcontinent would not be a constraint; producers would simply ship surplus NGL supply via southbound pipelines to salt dome storage sites in the Upper Texas Coast or southern Louisiana. Storage in the Northeast and Midcontinent now, however, generally fills to capacity limits.
In Mont Belvieu, storage capacity is not constrained, but brine pond capacity is again a constraint on both producers and consumers. Storage operators in Mont Belvieu need sufficient brine pond capacity to handle the cumulative seasonal inventory build during the offseason, as well as cumulative inventory withdrawals during winter months.
While North America's NGL markets can manage without any additional storage capacity, the lack of interregional NGL pipeline capacity for transportation of NGL raw mix will force producers in the Northeast to rely on rail transportation. Storage sites at the US Gulf Coast, however, are designed for pipeline receipts, and wait times for unloading rail cars are likely to increase.
Price trends; profitability
Petral Consulting tracks gas processing economics based on netback values of NGL raw mix for gas plants in Texas, New Mexico, and the Rocky Mountains. Gas plants in these regions are the primary sources of NGL raw-mix deliveries to NGL fractionators in Mont Belvieu.
Gas plant NGL production continued to increase during first-half 2015, but demand in domestic markets posted little growth. Domestic supply surpluses continued to increase and spot prices, particularly for propane and butanes, continued to weaken.
Petral Consulting estimates the weighted-average price of NGL raw mix in Mont Belvieu was 48¢/gal ($5.23/MMbtu) in first-quarter 2015 and slipped to 47¢/gal ($5.05/MMbtu) in second-quarter 2015 before weakening to 40-41¢/gal ($4.45-4.55/MMbtu) in the third quarter. Netback prices for gas plants in West Texas and New Mexico (those plants that ship product through new NGL raw-mix pipelines) were 37¢/gal ($3.88/MMbtu) in first-quarter 2015, 36¢/gal ($3.70/MMbtu) in the second quarter, and 29-30¢/gal ($3.09/MMbtu) in the third quarter. Based on netback pricing and Houston Ship Channel natural gas prices, gross margins for gas plants in West Texas and eastern New Mexico were 112¢/MMbtu in first-quarter 2015, 101¢/MMbtu in the second quarter, and 34¢/MMbtu during the third quarter.
Freight rates for deepwater LPG trade in international markets remained at historically high levels in first-half 2015 but began to weaken in August and September. According to a recent forecast prepared by Vinmar, an international LPG shipping consultancy in Norway, ship owners began taking delivery of new fully refrigerated LPG vessels in third-quarter 2015, with the increase in fleet capacity contributing to lower freight rates. As ship yards continue to deliver new vessels in first-half 2016, Petral Consulting anticipates further declines in freight rates for LPG spot cargoes.
Outlook
According to the Organization of Petroleum Exporting Countries' latest monthly Oil Market Report, Saudi Arabia increased crude oil production to 10.0-10.5 million b/d in second-quarter 2015, ostensibly to prove its determination to increase market share. In July, five of six countries approved the Iranian nuclear weapons containment agreement, and Iran will resume full oil production and exports sometime in first-half 2016.
Petral Consulting expects prices for global crude oil benchmarks to remain in the range of $40-50/bbl during second-half 2015 and first-half 2016.
EIA statistics for May and June 2015, however, showed US crude oil production in each of those months declined by 200,000 b/d-the first back-to-back declines in monthly production since 2010. The May and June production falls provide support for Petral Consulting's previous forecasts that the sharp decline in drilling activity will curtail crude oil production growth.
Since Petral Consulting bases its long-term forecasts for gas plant NGL production on crude oil production, slower growth in US crude output will result in slower growth in gas plant NGL production. Petral Consulting now estimates NGL production in the US Gulf Coast, Midcontinent, and Rocky Mountains will increase by 75,000-100,000 b/d during second-half 2015 and 0-50,000 b/d in first-half 2016.
Domestic demand for most NGL components will remain at current levels through yearend 2016 and into first-half 2017, but startup of two 750,000-tonne/year PDH plants will increase chemical feedstock demand for propane by 10,000-15,000 b/d in fourth-quarter 2015 and by an additional 10,000-15,000 b/d in first-half 2016.
Finally, Petral Consulting forecasts propane exports will stabilize at 550,000-600,000 b/d during second-half 2015 and first-half 2016, but butane exports will increase to 115,000-145,000 b/d in first-half 2016.
The author
Daniel L. Lippe ([email protected]) is president of Petral Consulting Co., which he founded in 1988. He has expertise in economic analysis of a broad spectrum of petroleum products including crude oil and refined products, natural gas, natural gas liquids, other ethylene feedstocks, and primary petrochemicals.
Lippe began his professional career in 1974 with Diamond Shamrock Chemical Co., moved into professional consulting in 1979, and has served petroleum, midstream, and petrochemical industry clients since. He holds a BS (1974) in chemical engineering from Texas A&M University and an MBA (1981) from Houston Baptist University. He is an active member of the Gas Processors Suppliers Association.
