Analysis yields turnaround benchmarks for allowance, contingency
Gordon Lawrence
AP-Networks
Amsterdam
Turnarounds—also known as planned outages or shutdowns—are major events for refineries and other petrochemical facilities. They typically cost large sums of money to execute. Cost estimates for turnarounds, however, have historically been rather inaccurate. This can often be traced to an inability accurately to calculate allowances and contingency for "unknowns" in the estimate.
This article examines the allowances and contingencies that are needed, the different methods used for calculating them, and how much money is typically allocated and required. From this, it provides some "rule of thumb" benchmarks for turnaround estimators to use.
It then will discuss how the benchmarks might be refined, the advantages of tracking the use of allowances and contingencies during execution of a turnaround, and finally some recommendations for steps that estimators can take to improve their estimating capabilities for allowances and contingencies.
Turnaround estimate accuracy
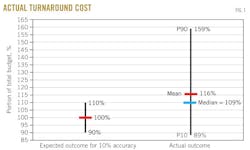
As an example of how turnaround cost estimates are notoriously inaccurate. Fig. 1 shows the average budget overrun for a sample of recent turnarounds. This sample is taken from the AP-Networks turnaround database, which contains execution data on more than 750 turnarounds from almost 40 firms at plants worldwide. It includes schedule data, execution information, and scope characteristic data, as well as the cost data referred to here.1
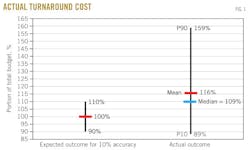
From this sample we can see that turnarounds typically overrun their estimates by an average value of 16%. Furthermore, the variability around that average is on the order of –27% to +43%, which is far wider than the ±10% at 80% confidence that most turnaround teams claim to be their estimate-accuracy level.
The reasons for this weakness in estimating can partly be explained by a lack of knowledge among owner companies' estimators as to how much money to allow in the estimate for the unknowns in their turnaround scope.
What are 'unknowns'?
Any turnaround will include a maintenance scope, consisting of:
• Inspection of equipment to company regulations or government mandatory rules.
• Inspection of pipework for corrosion and erosion damage, both internal (for example, process weak points) and external (for example, corrosion under insulation, or CUI).
• Cleaning, repair, and maintenance of equipment, pipework, and instrumentation (for example, pulling and cleaning heat exchanger tube bundles, repairing leaks in pipework, or checking of pressure-relief valves).
• Minor upgrades and modifications to the plants (items controlled under the "management of change" procedures).
Most turnarounds will also include a project scope, consisting of tie-ins (for future capital projects) that can only be installed when the plant is shutdown.
The scope of both maintenance and project that is known at the time of "scope freeze" can generally be estimated by the turnaround estimator, based on historical knowledge. Scope freeze is the date set by the team, by which time all interested parties—inspection department, plant operators, project teams, so forth—are to have offered all tasks they would like included in the turnaround. Those tasks have been challenged and accepted as being unable to be done during normal operations. This typically occurs around 9 months before the shutdown.
Problems arise, however, with allowing for unknowns. These consist of the additional work that inevitably creeps into the scope after the scope freeze date and the costs that grow beyond the original estimate, due to underestimation of quantities, optimistic estimation of productivity, changes in material costs, and so forth.
The unknowns are typically covered by turnaround estimators by their including in the estimate some kind of allowance or contingency funds. Some estimators simply include a single line item to cover all allowance and contingency eventualities. The likely areas needing to draw from that fund, however, will fall into one of four categories:
• Forgotten, overlooked work. This is work known before the scope freeze date but which, for whatever reason, was not included in the basis of estimate.
• Emerging work. This is work arising from equipment that breaks down or pipework that leaks after the scope freeze but before the start of the shutdown for the turnaround.
• Discovery work. This is work that was unknown (or only suspected) at the time of scope freeze, which could not be verified because access is impossible while the plant is running and which is only discovered when equipment or pipework is opened during the shutdown.
• True contingency. This refers to additional funds for items that simply end up costing more than originally allowed for in the estimate or for completely unexpected activities.
The categories of forgotten, overlooked, and emerging work are usually lumped together by turnaround estimators. This combined category is then typically known simply as either emerging work or additional work.
Calculating allowances, contingency
The problem for the estimators is how much money to include as allowance or contingency. There are effectively four basic methods for calculation:
• Using a predetermined percentage.
• Using expert judgment.
• Using a probabilistic risk analysis method such as Monte Carlo simulation.
• Using a regression model.
We can consider how each of these might be employed by a turnaround estimator.
Predetermined percentages can be a good "rough-and-ready" way of calculating contingency. But the issue always arises that, in order to know what the percentage should be, one needs some benchmark of what was needed in the past.
Using the "gut-feel" judgment of an expert can also be a good "rough-and-ready" way of calculating contingency. But, of course, one first needs the expert. Recent history of turnaround cost outcomes suggests that these experts are few and far between for turnarounds.
Probabilistic risk analysis uses a Monte Carlo simulation or similar method to calculate the contingency requirement and estimate range.
At first glance, Monte Carlo appears to offer the most scientific and by extension the most accurate method for calculating allowances and contingency. One study, however, casts some doubt on that assumption.2 It study looked at Monte Carlo in comparison to the other three methods discussed here. It focused on capital project estimates and therefore may not be fully transferable to turnaround estimates; nevertheless, its findings are instructive.
It was discovered that, contrary to general perceptions in the industry, for early estimates predetermined percentages and especially expert judgment provided results that were generally much better than the results from the supposedly more rigorous Monte Carlo method. Monte Carlo did provide better results for very detailed estimates, but the advantage it gave over predetermined percentages and expert judgment was slight.
The referenced article does not discuss in detail why Monte Carlo does not provide the expected superior results to the other methods, but it seems reasonable to assume that part of the reason is that Monte Carlo analysis is not always carried out with sufficient rigor and skill. The study looks at whether Monte Carlo was used, not whether Monte Carlo was used correctly.
A proper Monte Carlo analysis requires a well facilitated session to identify, analyze, and evaluate the risks and uncertainties in scope and estimate. That session in turn, requires sufficient detail in the estimate to allow the risks to be identified. It also requires the team to abandon the usual over-optimism that prevails in most discussions of contingency requirements.
Monte Carlo therefore may well be useful for contingency setting but only if used with sufficient rigor. Since most turnaround teams lack the skills and training in-house, they would need to look externally for support to implement this method successfully.
Developing a regression model can be a relatively accurate method for calculating contingency requirements, but it requires a large data set on which to build the model. Most owner-company estimators do not have such a data set available to them.
Benchmarks for allowances, contingency
What follows are some benchmark data that could be used by owners' cost estimators as rules-of-thumb in applying the predetermined-percentage method or the expert-judgment method to their turnaround cost estimates.
These benchmarks present the allowances and contingency as percentages of elements of the turnaround's cost estimate. Understanding them requires being clear about what is meant when we talk about an element of "the cost estimate."
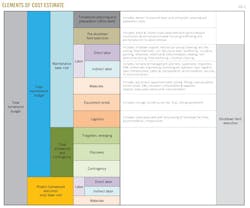
We have used the definitions as laid out in Fig. 2. The benchmarks are generally shown as percentages of one of the following:
• The total maintenance and project base cost (i.e., excluding allowances and contingency).
• The total maintenance base cost.
• The total maintenance budget.
The data sets used to calculate the benchmarks are drawn from the AP-Networks turnaround database mentioned earlier.
Allowances, contingency as a block value
These two benchmarks (Fig. 3) show the total allowances and contingency (i.e., forgotten work + emerging work + discovery work + true contingency) as one block, in comparison with different elements of the turnaround budget.
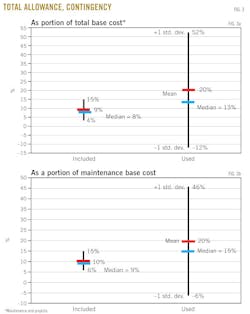
• Fig. 3a shows the total allowances and contingency as a percentage of maintenance base cost plus project base cost. Two benchmarks are given: how much teams included in their estimates and how much was actually used by those teams to complete the turnaround.
As can be seen, the teams included around 9% but actually used about 13-20%, suggesting that teams were consistently underestimating how much they would need.
In addition, the variability (the vertical line shows the standard deviation) in the value of how much was actually used, compared with the variability in the value of how much was included suggests that teams are thinking in terms of preconceived percentages that take insufficient notice of the amount of risk and uncertainty in their estimates.
Note: For those attempting to take a "back-bearing" and relate Figs. 3a and 3b to Fig. 1, bear in mind first that Fig. 1 is calculated as a percentage of total turnaround budget, whereas Figs. 3a and 3b are calculated as percentages of total base cost and of maintenance base cost, respectively. Secondly, bear in mind that Fig. 1 uses a larger data set than is used for Figs. 3a and 3b.
We were able to use a larger set for Fig. 1 because, while most turnaround teams are able to state their total budget and actual costs, far fewer teams track costs in sufficient detail to provide accurate information about the use of allowances and contingency within those totals. This in turn raises another interesting discussion point: The teams that can differentiate their allowances and contingency seem to overrun their budgets by less than the teams that cannot.
• Fig. 3a gives a benchmark comparing the allowances and contingency to the total base cost for maintenance and projects. The amount of project involvement in a turnaround, however, can vary considerably. Therefore, in Fig. 3b, we look at total allowances and contingency as a percentage of the maintenance base cost only (i.e., without the project base cost).
Despite this change in comparison basis, the results shown in Fig. 3b remain similar to those in Fig. 3a. This time the amount included is 10%, with the used amount around 15-20%. Once again, the variability in the amount used is much greater than the variability in the amount included.
Percentage breakdown
The previous two benchmarks looked at allowances and contingency as a single unit amount. This section looks at each allowance or contingency category separately.
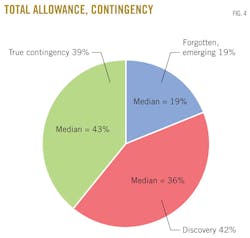
• Fig. 4 shows each allowance or contingency category as a percentage of the total allowances and contingency. The pie chart shows the average percentages and then the medians appear as separate notes in each pie segment. The average and the median are reasonably similar in each case, suggesting that the variability for each segment is only slightly skewed.
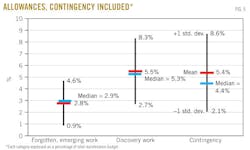
• Fig. 5 shows each allowance or contingency category as a percentage of the total maintenance budget (maintenance base estimate plus all allowances and contingency). Again, the mean and median are not greatly different.
Greater granularity
The benchmarks given in the earlier section are offered to guide turnaround estimators who have no other in-house data to begin using expert judgment or a predetermined percentage in their turnaround estimates.
These benchmarks, however, simply look at the overall average for turnarounds. From previously published research,3 4 we are already aware that certain characteristics of a turnaround and of turnaround planning affect turnaround cost predictability. These characteristics are listed below.
Since these affect cost predictability, they will, by extension, affect the amount of allowance and contingency required. Hence a next step in providing greater granularity in the benchmarks will be to provide benchmarks that take account of these characteristics.
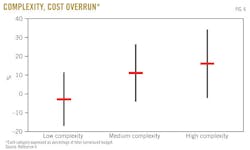
• Turnaround complexity. For example, as shown in Fig. 6, if we examine the complexity of the turnaround (where complexity is measured as a function of the percentage of the turnaround that involves project work, the total field-labor hours, and the interval time between turnarounds),5 we can see that more complex turnarounds appear to overrun more (as a percentage of budget) than less complex turnarounds.
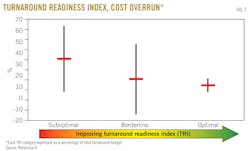
• Turnaround readiness. Similarly, as shown in Fig. 7, the level of turnaround readiness (i.e., the level of planning and preparation carried out for the turnaround, before the shutdown), as measured with the AP-Networks Turnaround Readiness Index (a quantitative measure, arising from the turnaround readiness pyramid questionnaire6), affects cost predictability. Better prepared turnarounds unsurprisingly have fewer cost overruns.
• Contract strategy. One other interesting point, raised by many turnaround teams, is whether field-labor contract payment type (e.g., unit rates, time, and materials, and so forth) affects turnaround cost predictability. One study suggests that, in comparison with complexity and readiness, contract type appears to have little to no effect on cost predictability in turnarounds.7
Data gathering, differentiation
Clearly, the more historical data one can gather on the use of allowances and contingencies in turnaround costs, the more benchmarks there are that can be refined. At AP-Networks, we continue to gather cost and characteristic data on every turnaround in which we are involved.
We routinely urge every turnaround team to differentiate the allowances and contingency in the estimate and clearly to track its use in the actual costs.
The cost estimator will frequently find his or her calculations challenged by management. If the estimator can produce a logical argument for how each allowance and contingency was calculated, this strengthens his or her argument for retaining the funds in the estimate.
Using benchmarks gives backing to any argument as to why a certain amount of allowance and contingency has been included. A further refinement in strengthening the argument, however, is if less of the estimate needs to be contingency, unallocated to a specific task or action. Therefore, let us examine all four categories of allowance and contingency to see whether we can better define them.
If we take each of the four categories in turn, we can see that in fact only one of the four categories, "true" contingency, really needs to be subject to a calculation technique such as expert judgment, predetermined percentage, or probabilistic risk analysis.
• Forgotten, overlooked work. If a team is conducting a thorough scope-gather exercise, involving all groups with a stake in adding scope to the turnaround, then this category should ideally be zero in every estimate. Tracking its actual value will give teams a clue as to how effective are their scope gathering techniques.
• Emerging work. It should be possible to estimate emerging work, based on knowledge of the reliability of the plant. For example, "We have X months between now and the shutdown. Typically, we have Y valves/month that fail. Therefore we should allow for X*Y failures in the estimate as emerging work."
• Discovery work. It should be possible to make an educated guess at discovery work, based on the operator's knowledge of how well the plant is operating, before the shutdown. For example, "Column X is only operating at 50% of capacity; therefore, we fully expect that when we open it there will be tray damage to repair."
• (True) contingency. True contingency is the only category that will still need to be left to expert judgment, predetermined percentage, or probabilistic risk analysis.
Forgotten, overlooked work, emerging work, and discovery work all now become "allowances" rather than "contingency" and can be assigned to specific line items in the cost estimate. They no longer need to be amorphous buckets of money, subject to suspicion and deletion. A clear case can be made for each cost item.
Following the same reasoning, just as with capital projects, the true contingency now becomes money that, by its very nature cannot be assigned to any specific line items, but which history or experience shows will be required somewhere during execution of the project for some element of the scope that was underestimated or overlooked.8
This then brings turnaround estimating more in line with capital cost estimating, where, if you can assign it to a specific line item in the estimate, it's an allowance; and if you can't but historical experience tells you that you'll need the money somewhere, it's a contingency.
Looking further now makes clear that the only one of the four categories that should be affected by the presence of capital projects in the shutdown scope is true contingency, since the three allowance categories all clearly relate to the maintenance scope only. Recognizing this should also help to make the calculation and use of contingency in turnaround budgets less opaque.
AP-Networks will continue adding to its database and examining this topic, delving deeper into the variables (complexity, readiness, contract strategy, etc.) that may affect the need for allowances and contingency.
References
1. http://www.turnaroundbenchmarking.com/database.html.
2. Burroughs, S.E., and Juntima, G., Exploring Techniques for Contingency Setting. AACE International, Washington, June 13-16, 2004.
3. Alkemade, J.M.G., "Key Leading Indicators of Turnaround Performance Outcomes," Plant Maintenance Middle East Conference, Dubai, Nov 26-28, 2007.
4. O'Kane, M., "In Search of Excellence: Benchmarking Turnaround Outcomes and Practices," Turnaround Industry Networking Conference, Houston, Sept. 24-26, 2011.
5. http://ap-networks.com/tools/turnaround-network.html.
6. http://ap-networks.com/services/turnaround-assist-program-t-ap.html.
7. Lawrence, G.R., "Contract Strategies for Turnarounds—A comparison of the use of Unit Rates versus Time & Material," Turnaround Industry Networking Conference, Houston, Sept. 24-26, 2011.
8. The exact definition of contingency, given by the Association for the Advancement of Cost Engineering—International in its Recommended Practice 10S-90 "Cost Engineering Terminology," is "An amount added to an estimate to allow for items, conditions, or events for which the state, occurrence, or effect is uncertain and that experience shows will likely result, in aggregate, in additional costs."
The author

More Oil & Gas Journal Current Issue Articles
More Oil & Gas Journal Archives Issue Articles
View Oil and Gas Articles on PennEnergy.com