Space-based hyperspectral pipeline monitoring launches Q2 2023
R. Peter Weaver
Orbital Sidekick Inc.
San Francisco
Starting over the next 1-3 years, the evolution of monitoring and control systems will drive industries to reimagine their approaches to asset monitoring and reporting, particularly in the oil and gas realm. This will begin especially with large-scale, long-distance, remote assets like pipelines.
A big step in this direction will take place Apr. 1, 2023, when SpaceX Transporter 7 deploys Orbital Sidekick (OSK) Inc.’s first two monitoring spacecraft. Commercial hyperspectral monitoring will follow in May. A second launch on Transporter 8 will put a third satellite in orbit during June 2023, with Transporter 9 carrying satellites 4-6 into space in October. More launches will follow in 2024.
Collectively, these assets will make up the Global Hyperspectral Observation Satellite (“GHOSt”) Constellation. GHOSt will allow hyperspectral collection and analyses of the conditions surrounding any asset around the globe, and will include daily actionable reporting on hydrocarbon leaks, encroachment, and change detection for pipeline assets.
Preparation for commercial operations using GHOSt required extensive testing and development work in:
- Data collection.
- Data analysis.
- On-line reporting of actionable information to clients.
This article will provide a brief synopsis of what hyperspectral imagery is and present select results from pilot testing work, including field results and analysis.
Hyperspectral imagery
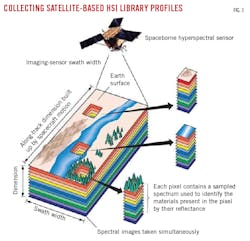
Fig. 1 illustrates this concept with a simplified depiction of a satellite traversing the surface of the earth, collecting the surface reflectance values for each wave band for each pixel within the scanned swath. With each scan, a data stack is collected for each pixel in the line and each stack is geolocated. Resulting reflectance values across the stack can then be plotted as hyperspectral profiles, representing the characteristics of the surface at any given point.
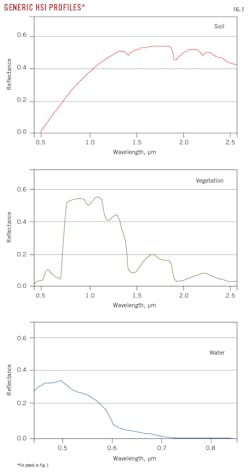
Fig. 2 presents generic characteristic curves for soil, water, and vegetation for the three pixels in Fig. 1.
Available HSI information
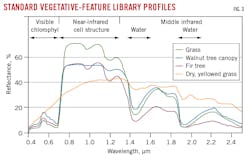
To date, publicly available spectral libraries focus on minerals and soils, agricultural and vegetative features, manmade objects and materials (such as roofing and steel), water and certain liquids, and select chemical compounds. Fig. 3, for example, includes standard agricultural features for several common species.
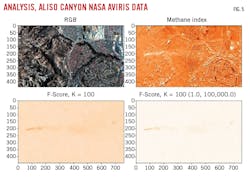
Similarly, publicly available archives exist of HSI collected from certain US-government satellite and aerial assets, notably the National Aeronautic and Space Agency (NASA) Hyperion satellite and its aircraft-based Airborne Visible Infrared Imaging Spectrometer (AVIRIS) program. As one example, data collected in 2015 from Hyperion over Santa Barbara, Calif., allowed application of hydrocarbon profiles to identify the Refugio pipeline oil spill. Fig. 4 shows the spilled oil indicated in white in the frame on the left, and false orange over the red-green-blue (RGB) image to the right.
The lower images of Fig. 5 show application of additional algorithms—including a known hyperspectral methane profile—allowing the plume to be more positively identified. Each of these four images are from the same HSI data stack.
This exercise in finding a natural gas leak illustrates how it is possible to utilize HSI to identify specific features of particular interest, in this case methane signatures. In a similar fashion, OSK is collecting its own HSI to objectively analyze pipeline rights of way for leaked hydrocarbons, soil disturbances and mechanical surface disruptions, new construction, vegetative stresses, and other changes.
Data processing
Once a suite of hyperspectral data is at hand, the HSI may be analyzed for specific features of interest. Historically, the persistent difficulty in creating this sort of cohesive solution is the sheer volume of data. Consider that a standard color image consists of just three bands: red, green, and blue. Collecting hundreds of narrower bands from an HSI sensor creates an exponentially increased burden—two orders of magnitude—on all components of the data architecture, including:
- Storage on the satellite until in contact with a ground station.
- Transfer from satellite to ground station.
- Transmission from ground station to production system.
- Management within the production system.
- Use within the analytic application.
- Refinement into a consumable format (often constrained by customers’ systems).
At each stage in the data’s progression, complexities emerge which demand purpose-built systems to handle the increased volume. Most commercial data systems were not designed to ingest and process such large-volume, multi-dimensional HSI data cubes. Attempting to process such data without suitable tools will result, at best, in unacceptably long processing times. At worst, the data will be stored and never analyzed.
Customer interface
A critical third component of a hyperspectral analysis tool is the presentation of findings to the end user. The absence of this final layer, the application layer, until now has been yet another barrier to more widespread adoption of HSI data and analysis. Until recently, HSI was the domain of large governments only. As such, there was a dearth of applications to support data interpretation.
HSI data is rich, but only useful if mined effectively. The new user interface discussed here allows users to not only access their imagery, but quickly isolate individual anomaly reports and feature mapping, as well as add and review remarks on each call, including validation, explanation, and resolution.
The means by which newly accessible satellite-based information streams are made usable to the market will be as important, if not more important, than the underlying technology. Rights-of-way currently are being depicted with findings of anomalies overlaid as they are identified by either land- or air-based means.
Pilot programs
Pilot programs conducted by OSK since mid-2018 have used proprietary first generation (Gen I) imaging equipment on various aircraft, on a small unmanned aerial vehicle (sUAV), and via its Hyperspectral Earth Imaging System Trial (HEIST), an orbiting unit deployed on the International Space Station. The HEIST prototype was decommissioned, according to plan, at end 2019.
On June 30, 2021, a second generation (Gen II), high-spectral resolution satellite named Aurora served as a second space-based pilot in preparation for deployment of the GHOSt constellation starting in 2023. Aurora validated sensor capability from space across all 500 light-spectrum bands between 400 and 2,500 nanometers (nm).
Each of these platforms collected HSI, with subsequent analysis of the resulting data seeking out signatures of interest to the oil and gas industry and growing the available library of spectral profiles.Underground gas leak
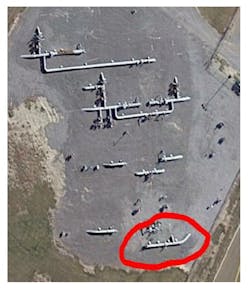
Applying HSI during an initial, routine aerial patrol over a 100-mile underground natural gas pipeline, a significant soil anomaly was identified at a regularly patrolled manifold, demonstrating the applicability and potential of this technology to energy infrastructure monitoring. Fig. 6 shows a full color image of the manifold, with the circled area indicating the anomaly’s location, undetectable on the ground by human observation.
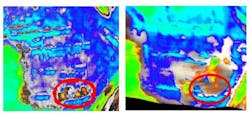
Fig. 7 depicts the same manifold, showing a hyperspectral presentation of the soil anomaly on the left. Note the area circled in red, evidencing a clear soil disturbance potentially caused by, and indirectly indicating, a hydrocarbon leak. Further investigation confirmed a small 0.5-in. corrosion leak at this location on a 10-in. OD pipeline buried 1 m below grade.
Aboveground crude leak
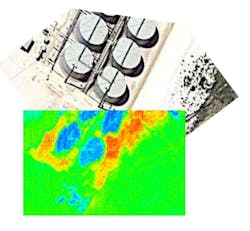
Fig. 8 shows another example of a spill, not visible optically but detected by HSI. This small tank battery was in the middle of a West Texas crude gathering system. Visual observations via aerial patrol failed to detect anything out of place. A tank, however, had failed the week before, saturating the surrounding soil with light crude. No standing product remained, but an HSI patrol clearly identified the contamination.Satellite rupture detection
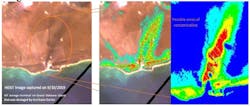
Fig. 9 positively identifies a leak at what was then Equinor ASA’s 6.75-million bbl South Riding Point oil terminal on Grand Bahama Island caused by Hurricane Dorian’s September 2019 landfall. The RGB image shows a smudge that could indicate something of interest, or a shadow, or a natural geologic feature. Hyperspectral analysis gave a much clearer indication of spilled hydrocarbon, and the surrounding soil anomaly caused by storm-surge inundation. HEIST collected this image just 2 days after the storm passed.Fire risk
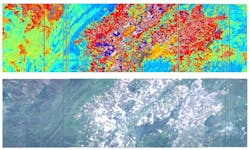
While a current priority is harnessing HSI technology to identify oil spills, vapor emissions, and threats to oil and gas infrastructure, there are numerous tangential threats that may also be learned about through access to this data and imagery. In the example in Fig. 10 application of the combined algorithms for atmospheric moisture, carbon senescence, and vegetative health, can depict overall fire risk to a geography. This imagery was also collected in 2019 over a portion of California by HEIST.
Fig. 10’s lower frame is a simple RGB portrayal of the area. The frame above indicates areas of especially high fire risk in red. Areas of moderate risk are in yellow and green, and areas of lowest risk in blue. It was prepared for use by an electric utility in support of prioritizing right-of-way maintenance.
Spectral library development
The examples presented so far, all used Gen I imagery from multiple platforms to prove the utility of HSI technology for midstream asset surveillance. Commercial success of hyperspectral monitoring will require a robust ability to identify such anomalies with confidence, with a minimum of false positive findings, and with false negatives kept to a manageable level. As pilot programs continue, the main priority using Gen II technology will be building an increasingly robust library of applicable spectral profiles, including both liquid contaminants and aboveground vapor plumes.
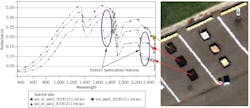
Fig. 11 shows imagery collected by drone over soil samples in a parking lot. The soil was contaminated with known quantities of motor oil. Resulting profiles demonstrated both how increased quantities of contaminants reduce reflectance values consistently across the curve, and that the presence of motor oil introduces a characteristic feature at both 1,750 nm and 2,350 nm regardless of the underlying soil medium.Similarly, aerial Gen II imagery was collected over controlled natural gas (methane, CH4) releases.
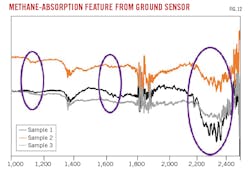
With the collection of numerous ground imagery samples over different known methane vapor plumes at different times of day, it was demonstrated again that characteristic features can be consistently identified and correlated with the contaminant (Fig. 12). As would be expected, the prominence of the spectral feature is correlated to the strength or concentration of the contaminant. With each exercise the understanding of detection thresholds and wind effects using latest-generation satellite data becomes better established.
The author
R. Peter Weaver ([email protected]) is vice president of business development at Orbital Sidekick Inc., San Francisco, Calif. He has also served as vice president, government affairs at the International Liquid Terminals Association. Before that, he held roles in product development, marketing, technical sales, and terminal operations and logistics at ExxonMobil Chemical. Peter has also served in the Merchant Marine. He holds an MBA from the University of California at Los Angeles, a BS in chemical engineering from the University of Virginia, and an AD in marine engineering from Northwestern Michigan College.
