Integrated engineering repurposes infrastructure for carbon capture
Repurposing existing wells and pipelines for carbon capture and storage (CCS) must consider the state of existing equipment and its suitability for CO2 service. Plugged and abandoned wells may lack integrity information, and the location of existing wells may not be optimal for injection.
ENI SPA evaluated a CCS hub project in Ravenna, Italy, by screening 12 reservoirs, building petrophysical models, dynamically modelling CO2 injection, and analyzing geomechanical effects from injection. The study showed that an integrated approach for depleted reservoir evaluation is required to convert reservoirs from gas producers to CO2 storage, and that the Ravenna storage site is suitable for a pilot project.
The Ravenna project modeled the injected stream as 100% CO2 with a corrected Peng-Robinson equation. Pressure-volume-temperature (PVT) properties of CO2 with impurities, however, differ significantly than pure CO2. To address this issue, Petronas analyzed several equation-of-state (EOS) models for CO2 injection in an offshore Sarawak CO2 storage project. History matching revealed the model which accurately predicted wellhead injection pressures and the study defined the range of model predictions under various field conditions.
CCS clusters
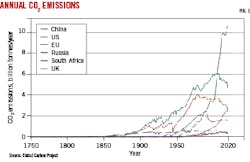
Reported CO2 production from burning fossil fuels for energy and cement production has increased nearly seven-fold over the past 70 years, to a current rate of about 34 billion tonnes/yr.1 In 2020, China was the highest emitter, accounting for 10.6 billion tonnes. The US was the second highest emitter at 4.7 billion tonnes and the EU was third at 2.3 billion tonnes. Since 2005, most countries decreased or stabilized CO2 emissions, except for China (Fig. 1).
Energy efficiency, alternative clean energy, and CCS all reduce carbon emissions. Without value placed on carbon storage, CCS is a strictly cost-based option and has not yet been widely adopted. Therefore, efficiency must be built into any CCS project, and this has driven the market to consider repurposing existing depleted reservoirs, reusing infrastructure, and developing CCS in clusters (Fig. 2).
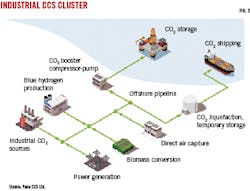
CCS clusters exploit economy of scale by collecting carbon from emitters in shared infrastructure and transporting to nearby storage fields. CO2 is transported in either a supercritical state or gaseous phase. The former is more efficient but requires high-pressure rated infrastructure.
Currently, there are no large-scale commercial CCS cluster operations, but targeted CO2 disposal sites are operating in Sleipner field, Norway, Gorgon field, Australia, and Enping field, China. These projects export CO2 from single-source emitters to dedicated geological storages using purpose-built transportation and injection and were designed based on conventional oil and gas applications. Lessons learned from these projects, particularly at Gorgon where corrosion rates are about 100x higher than predicted, suggest that CCS hubs need specialized knowledge to handle CO2.2
Repurposing infrastructure for CCS
Repurposing existing wells and pipelines for CCS considers the state of existing equipment and requirements for CO2 transport. Plugged and abandoned wells may lack integrity information and not be suitable, and location of existing wells may not be optimal for injection.
There is no current standard to qualify existing wells for CO2 injection. Guidelines for CO2 injection in repurposed wells have been presented by Raza et. al.3 The REX-CO2 consortium project developed a screening tool to evaluate existing wells for CO2 service and produced an extensive list of documents related to design of CO2 wells.4
In general, there are no issues with reusing existing pipeline for CO2 service, but like wells, there are no standard procedures or guidelines to evaluate and convert existing pipelines. Considerations for conversion include:
- Flow assurance studies to estimate hydraulic capacity of the pipeline and verify that operating pressures do not exceed design pressures.
- Corrosion risk assessment to identify carbonic corrosion in the presence of free-phase water, including risk assessment from H2S corrosion, stress cracking, and O2 corrosion.
- Studies of mechanical integrity and running ductile-fracture potential.
Captured CO2 is almost never pure, and potential impurities need to be determined and assessed with respect to flow assurance. Up to 20 impurities are possible in a CO2 flow stream which could change thermodynamic properties versus pure CO2. These include increased corrosion rates or hydrate formation.
CO2 is optimally transported in a liquid-like supercritical phase above critical pressure. Flow analysis should ensure that flowing pressures remain above critical pressure to prevent two-phase flow in the pipelines. Although multiphase flow is standard in normal pipeline service, two-phase flow is poorly understood and modeled for CO2. Impurities affect critical pressure, and these need to be quantified and properly modelled to ensure the pipeline is operating above the real critical pressure of the contaminated fluid. Additionally, corrosion rates will be high in the presence of free water, and aqueous phase formation is affected by salt, glycol, or methanol impurities. An accurate EOS model for impure CO2 is required for this modeling.
Converting depleted reservoirs into CCS sites requires integrated studies to ensure safe transportation, storage, and retainment of carbon at the site. The following sequential steps are required to ensure a reservoir is suitable for CCS:
- A screening evaluation for stored volume, injectivity, containment, and monitorability.
- An updated 3D reservoir model to determine injection volumes, injection profiles, and plume evolution.
- A series of laboratory tests of PVT properties, relative permeability, and chemical stability.
- Specialist studies to determine caprock integrity, fault stability, thermally induced fracturing tendencies, and reactive modeling.
- Well construction assessment including materials, completion design, cementing practices, and abandonment strategy.
- A pilot program that mitigates identified risks.
- Full-scale development based on lessons learned from the previous steps.
- Continuous monitoring of the development through abandonment.
The screening phase determines the volume of CO2 that can be stored based on material balance (replacing volume of hydrocarbon produced with CO2). Injectivity determines operating conditions under which the reservoir can accept CO2 and guides injection schemes. Containment of carbon is determined by caprock continuity and thickness; the project is not feasible if CO2 migrates away from the reservoir. A monitoring program determines where CO2 migrates within the reservoir.
Integrated CCS reservoir analysis requires a detailed 3D reservoir model based on the current state of the reservoir. A static model includes zones between top and bottom of the reservoir, overburden and underburden formations, and faults. Laboratory results calibrate the reservoir model by quantifying reservoir rock properties in the presence of original fluid and injected fluid. Modeling considers chemical reactions between rock and CO2 for transition from an equilibrium model between rock and fluids to a radial reactive transport model for porosity-permeability variations, well injectivity, near wellbore salt precipitation, and mineral alteration.
Depending upon hydrocarbon extraction, the reservoir can contain widely varying pore pressures and stresses throughout the strata. Geomechanical characterization, complete with history matching, quantifies evolution of the stress regime in the reservoir and cap rock. Thermal analysis based on geomechanical modeling determines changes in the stress regime under CO2 injection. Thermally induced fracturing, potentially leading to changes in injectivity or loss of containment, is identified at this stage.
ENI Ravenna hub
ENI SPA is developing a CCS hub project in Ravenna, Italy, to capture and transport carbon emissions from local plants to nearby storage reservoirs.5 The reservoirs are part of exhausted natural gas fields in the area and, as such, have well-known properties and production history.
Ravenna hub is in the northern Adriatic basin and is a sedimentary, epicontinental, normally consolidated basin bounded by the Alps to the north, Apennines to the south, and Dinarides to the East. Most gas fields in the area produce from reservoirs in thrusted anticlines, simple drape structures, and stratigraphic traps. Gas accumulation occurred in multilayered reservoirs with thicknesses up to tens of meters. Average reservoir depths are 1,500-4,000 m. Porosity, permeability, and water saturation range from 25-30%, 5-1,000 md, and 25-75%, respectively. Net-to-gross is 27% in silty sands and 95% in coarser sands. Reservoirs are sealed by adjacent shales and impermeable sandstones.
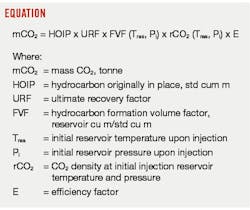
Material balance determines storage capacity per Equation 1. Initial reservoir conditions refer to the initial conditions of the depleted reservoir before injection, not conditions that existed before gas extraction. The efficiency factor considers non-ideality of the injection process. It is evaluated based on horizontal permeability (Kh), compressibility of the reservoir, and aquifer strength. It is in the range of 0-1.
A screening of 12 reservoirs based on injectivity and number of perforated wells revealed that one reservoir (Alpha) represented the average injectivity and number of perforated wells in the field and selected it as the first trial candidate. Alpha is a multilayered sandstone reservoir a few kilometers offshore Ravenna and had been in production since the 1960s. Reservoir pressure is above critical point for CO2 for injection into the reservoir in a supercritical phase. Only one layer in the reservoir will be injected based on its weak aquifer strength, low bottom hole pressure (compared with other layers), and high CO2 storage capacity. Ultimate storage in this layer is 20 million tonnes CO2 per material balance.
Static modeling defined areal extent of the study, including nearby fields and areas in hydraulic communication. Reservoir geometry is consistent among fields in the study with northwest-southeast axes leaning against a northeast inverse fault with similar stratigraphic succession among pre-Pleistocene age levels. Limits of CO2 injection were defined by three major sealing faults which are pressure boundaries. The 3D reservoir simulator grid was extended outside these limits to better model geomechanics, but geological, dynamic, and geomechanical evaluations were performed only inside the fault-bounded area.
Petrophysical modeling included 2D distribution of net-to-gross (NTG), effective porosity, and irreducible water saturation. Permeability was distributed based on core data and three different porosity-permeability correlations. Gas-water contacts were separately defined between the fields and communicated only through the aquifer.
Dynamic modeling incorporated production and pressure data, well events, rock-physics correlations, and fluid models. Because the field is 99% dry methane, only CH4 and CO2 were included in the compositional EOS model. The injected stream was 100% CO2 modeled with a corrected Peng-Robinson equation. Relative permeability curves were obtained from core data. Relative permeability hysteresis described fluid imbibition of water into the reservoir during production phase and secondary drainage from CO2 injection.
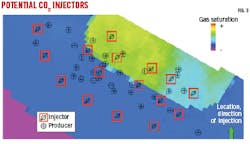
Once the dynamic reservoir model was history matched, injection scenarios forecast plume development. An injection-well location was determined based on distance from existing wells for monitoring. Fig. 3 shows proposed injection locations (outlined in red), shut-in producers, and expected methane gas distribution at start-up of CO2 injection. The best injection location and direction is indicated by the green arrow at the southeast part of the reservoir in an area flooded by the aquifer after gas extraction.
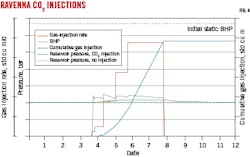
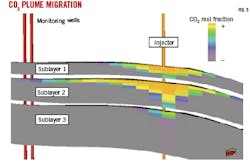
One year of injection was simulated with the dynamic model at maximum rate after a few month’s initial ramp-up. Fig. 4 shows the injection profile. After ramp-up, reservoir pressure only slightly increased, then decreased as the CO2 plume evolved within the reservoir. Injection into a flooded zone resulted in CO2 migration toward the top, spreading below the methane zone once the plume reached the high residual methane saturation area (Fig. 5). The model plume migration identifies existing wells that could be converted to monitoring wells.
A single-well mechanical earth model (MEM) based on Young’s modulus and Poisson’s ratio with normal stress state and horizontal isotropy showed that caprock integrity is maintained as long as injection pressure is below minimum stress, regardless of injection thermal effects. Thermally induced fracturing around the injector is considered unlikely. Better estimates of stress state and refined geomechanical analysis will come from pilot well core and borehole imaging data.
The study showed that an integrated approach for depleted reservoir evaluation is required to convert the reservoirs from gas producers to CO2 storage, and preliminary investigations suggest that the Ravenna storage site is suitable for a pilot project.
Impure CO2 modeling
CO2 with impurities can have significantly different PVT properties than pure CO2. To address this issue, Petronas performed a novel CO2 EOS modeling study for an offshore Sarawak storage project.6 Carbon capture is from a carbon capture platform 200 km offshore in about 110 m of water adjacent to an existing wellhead platform, flare structure, and central processing platform (CPP). Captured carbon is transported 140 km to an injection platform over a depleted gas reservoir.
The carbon-capture platform receives CO2 from a rich permeate stream from the CPP, where it is compressed by a booster compressor and processed to recover some hydrocarbons and concentrate CO2 to higher purity (> 95 mol%). The CO2 will still contain a mixture of impurities, resulting in different PVT properties than pure CO2.
Integrated flow-assurance studies evaluated EOS sensitivity to these impurities to quantify likely pipeline pressure-drop and wellhead injection pressure (WHIP). The GERG-2008 EOS model was used as the starting point of a model for CO2 with impurities. The current version of GERG-2008 is for binary mixtures of impure CO2, but it is not clear if it can accurately model CO2 with multiple impurities, as expected in the Sarawak storage project, due to lack of experimental data for matching purposes. To address this issue, cubic EOS PR1978 and modified EOS PR1978A, which are known to reasonably accurately model CO2 density with impurities using the Peneloux density correction, were incorporated into the modeling study to produce a range of likely pipeline and wellhead injection pressures.
Injection wellhead pressure
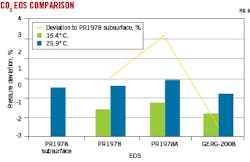
Minimum and maximum seabed temperatures of 16.4° C. and 25.9° C. set the expected range of fluid temperatures delivered from the 140-km subsea pipeline to the injection platform. Fig. 6 shows estimated early-life wellhead pressure using the three different EOS models with similar injection rates. Although predicted wellhead pressures were not reported, deviation among EOS models using the PR1978-calculated WHIP as a standard, show that the models varied from -2.5 to 3%. Late life predictions ranged from -1 to 4.3% deviation around the standard. GERG-2008 best matched the standard, and consistently predicted lowest injection pressure because it calculates higher densities than the other models. Similarly, the lower seabed temperature calculations always produced lower WHIP due to higher fluid densities.
Pipeline pressure drop
Pipeline pressure-drop analysis followed a similar process to the wellhead pressure study using a 140-km, 16-in. subsea line. Temperature ranges were the same as in the injection wellhead study.
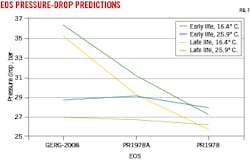
Differences up to 25 bar were observed between the models (Fig. 7). Predicted PR1978 pressure drop showed more sensitivity towards temperature, followed by PR1978A. GERG-2008 showed less temperature sensitivity based on more uniform density and viscosity estimates across the subsea temperature range.
Total pressure drop
Eight cases combining pipeline and wellhead models were run using PR1978 and GERG-2008 models with a mixture of the subsea maximum and minimum temperatures specified in the above studies (calculated pressure drops from PR1978A were between the two models and were excluded from the results for clarity).
The base case using PR1978 with maximum well temperature and minimum pipe temperature predicted the highest pipe inlet pressure. It can be used in modeling studies to determine the highest expected inlet pressure. A case run with similar temperatures did not reduce outlet pressure significantly.
The GENG-2008 model had lower outlet pressures than the PR1978 predictions. The lowest outlet pressure came from a case run with the GENG-2008 model using minimum well temperature and maximum pipeline temperature as input. This correlation can therefore define the lowest expected inlet pressure in modelling studies. The range of likely operating pressures for the project can be defined using both GENG-2008 and PR1978 models.
References
- Ritchie, H., Max Roser, M., and Pablo Rosado, P., “CO2 and Greenhouse Gas Emissions,” Our World in Data.org, August 2020.
- Ceyhan, I., Pilisi, N., Suryanarayana, P.V., and Krishamurthy, R.M., “Design of Carbon Capture and Sequestration CCS Wells,” IADC/SPE-208738-MS, IADC/SPE International Drilling Conference and Exhibition, Galveston, Tex., Mar. 8-10, 2022.
- Raza, A., Gholami, R., Rezaee, R., Bing, C.H., Nagarajan, R., and Hamid, M.A., “Well selection in Depleted Oil and Gas Fields for a safe CO2 Storage Practice; a case study from Malaysia,” Petroleum, Vol. 3, No. 1, March 2017, pp. 167-177.
- Luna-Ortiz, E., “Reusing Existing Infrastructure for CO2 Transport: Risks and Opportunities,” Offshore technology Conference Asia, Kuala Lumpur, Mar. 22-25, 2022.
- Martin, M., Bonanomi, S., Grilli, F., Biason, E., Brignoli, M., Monaco, S., Ricci, S., Cerdini, S., Morsetti, C., Bardini, S., Simoni, M., and Masserano, F., “Multidisciplinary Reservoir Study for Pilot CO2 Injection in Depleted Gas Reservoirs,” OMC-2021-078, 15th OMC Med Energy Conference and Exhibition, Ravenna, Italy, Sept. 28-30, 2021.
- Zakaria, M., Hashim, W., Omar, N., Norpiah, R., Bakar, M., and Mohamad, W., “Case Study: The Importance of Integrated Flow Assurance Modeling for Carbon Capture and Storage CCS Project,” OTC-31536-MS, Offshore Technology Conference Asia, Kuala Lumpur, Mar. 22-25, 2022.
About the Author

Alex Procyk
Upstream Editor
Alex Procyk is Upstream Editor at Oil & Gas Journal. He has also served as a principal technical professional at Halliburton and as a completion engineer at ConocoPhillips. He holds a BS in chemistry (1987) from Kent State University and a PhD in chemistry (1992) from Carnegie Mellon University. He is a member of the Society of Petroleum Engineers (SPE).