Hydrocarbon supply-chain grapples with methane abatement
Chris Goncalves
Berkeley Research Group LLC
Washington, DC
Athanasia Arapogianni
Berkeley Research Group LLC
London
Joanna Martin Ziegenfuss
Katie Bays
Berkeley Research Group LLC
Washington, DC
Cleaning up the natural gas and LNG supply chains is essential both for preserving or expanding their share of future energy demand and for maintaining gas suppliers’ social license to operate. Gas is the cleanest fossil fuel, but attendant methane (CH4) emissions are no longer socially or politically tolerable for many major buyers, and new satellite and aircraft-mounted detection technology has been deployed to name and shame bad actors. Now is the time for natural gas and LNG supply chain participants to develop and implement effective strategies for CH4 emissions abatement, certification, valuation, and related commercialization approaches.
Background
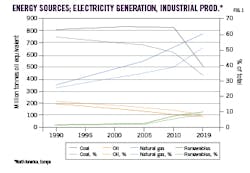
North America and Europe have led global decarbonization efforts over the last 20 years, and a substantial portion of their success can be attributed to their vastly increased reliance on natural gas and renewable generation in the energy mix (Fig 1). Emissions reductions have come primarily through replacement of substantial coal-fired generation with natural gas generation, which emits roughly half the CO2/Mw-hr of coal generation.
To sustain these decarbonization trajectories, and to extend the trend to coal-dependent economies in Asia, even greater volumes of natural gas will be required, as the scope and magnitude of energy transition objectives is too great for renewable energy alone. Global electric generation capacity is projected to grow at a rate of 2.8%, or 246 Gw/year net of retirements, for a total increase in capacity of 2,711 Gw by 2030.1 An estimated 683 Gw of installed coal-baseload generation capacity will retire by 2030, and 1,788 Gw of installed natural gas capacity will still be operating.
To supply electricity demand growth and retire or replace all coal and natural gas generation, up to 1,150 Gw of clean renewable capacity would be needed each year by 2030 (for a total of 11,586 Gw), assuming a weighted average 25% generation capacity factor for wind and solar.2 This is out of reach even as an aspirational goal. For example, the International Energy Agency’s (IEA) ambitious Net Zero by 2050 report calls for annual renewable capacity installations to average 730 Gw between 2020 and 2030, which is only 63% of the 1,150 Gw needed to fully serve load growth and displace both coal and natural gas generation. Further, the 1,150 Gw requirement and 730 Gw IEA target for average annual renewable installations are respectively almost 4.0 and more than 2.5 times the record-setting 290 Gw of renewable installation achieved in 2021.3
As a practical matter, therefore, the energy transition will require both significant growth in renewable energy installation and sustained natural gas development to achieve global decarbonization targets. Natural gas has a critical role to play, but the industry also faces mounting environmental opposition due to its substantial greenhouse gas (GHG) emissions. Carbon dioxide (CO2) and CH4 emissions occur throughout the natural gas supply chain, and, if left unmitigated, their global warming effect will threaten companies’ profit margins and social license to operate.
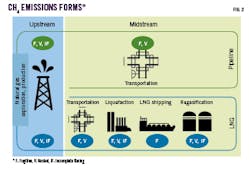
CH4 is the primary component of natural gas and CH4 emissions result from three primary sources (Fig. 2):
- Emissions from incomplete flaring (IF), coming from the process of burning gas either to dispose of large amounts of unwanted gas or for safety reasons or related to maintaining pressure in parts of the equipment. The gas is mostly converted to CO2, however, part of it is not, and therefore released to the atmosphere as CH4.
- Vented emissions (V) stemming from intentional releases of gas to safely dispose of it.
- Fugitive emissions (F) resulting from unintended leaks in pipelines, processing, and compression equipment.
Pipeline, LNG emissions
To evaluate the relative emissions intensity (EI) of pipeline and LNG routes, we analyzed the CO2 and CH4 emissions footprint of the natural gas and LNG supply chains along 13 of the largest international trade routes. We collected data on the GHG emissions footprint of the upstream and midstream-transportation segments of each trade route and calculated the EI by dividing total emissions by the annual trade volume. The authors selected the 13 largest export pipeline and LNG delivery routes from several major producing countries to the largest import markets in the European Union (EU) and East Asia based on statistics from the 2020 BP Statistical Review. These routes collectively represented 51% of 2020 global LNG trade.
CH4 estimates are based on CH4 emissions in the oil and gas industry from IEA Methane Tracker, gas sector’s emission intensity, and other assumptions from studies published by DBI Gas und Umwelttechnik GMBH, Imperial College (London), and International Maritime Organization (IMO), using the 20-year global warming potential for CH4 which indicates it is 86 times more potent than CO2. CO2 estimates are based on CO2 emissions from flaring, as reported in the 2021 BP Statistical Review and other assumptions from studies published by DBI Gas und Umwelttechnik GmbH, Imperial College (London) and IMO. These data remain early estimates subject to ongoing rapid progress in detection and measurement.
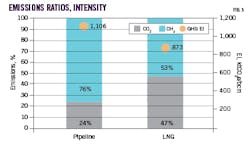
Fig. 3 presents the average GHG EI for the analyzed pipeline and LNG routes (the yellow circle marker for kilotons of CO2 equivalent per billion cu m, kt CO2eq/bcm, on the right axis) and the ratio of CO2 and CH4 emissions in pipeline and LNG routes respectively (blue and black bars on the left axis). GHG EI is presented as a weighted average, considering the volume of imports along each route.
These results led to two key observations:
- Average GHG EI of LNG routes is substantially lower than average GHG EI of pipeline routes.
- This is partly because, on average, LNG route emissions consist of 53% CH4, while pipeline routes include 76% CH4.
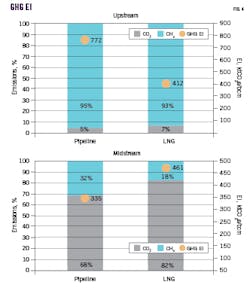
This article’s analysis covers GHG emissions along the pipeline and LNG supply chain from the wellhead in the producing country to the beach or border of the destination country. Upstream GHG EI includes emissions from oil and gas production and midstream includes emissions during pipeline transportation and LNG liquefaction and shipping. Fig. 4 breaks down the average GHG EI of the upstream and midstream segments of the supply chain.
Analysis indicates that:
- Pipeline upstream GHG EI exceeds LNG upstream GHG EI.
- Conversely, LNG midstream GHG EI exceeds pipeline midstream GHG EI.
With respect to the breakdown of the GHG EI into CH4 and CO2:
- For the leading international pipeline and LNG import routes, the lion’s share of total supply chain emissions comes from upstream CH4 emissions in the producing countries.
- Midstream CH4 EI of pipeline routes is greater than LNG’s.
- Midstream CO2 EI of LNG routes is greater than for pipelines.
These upstream and midstream emissions profiles reflect a mix of the vented upstream CH4 as well as fugitive CH4 detected along aging long-haul pipeline routes as compared with lower emissions factors for newer, efficient LNG export terminals and their upstream gas sources.
Methane’s outsized impact
A serious committed effort to reduce CH4 emissions is overdue for the natural gas and LNG industry.
In July 2021, the Intergovernmental Panel on Climate Change (IPCC) published its sixth assessment report, which stated unequivocally that deep reductions in GHG emissions are needed to limit global warming to 1.5° C. before 2050. To achieve this, the IPCC emphasized that the pace of emissions reductions must intensify for both CH4 emissions and CO2.
Due to its potent near-term global warming impact, CH4 is especially critical as governments aim to reduce emissions as quickly and efficiently as possible. According to the IPCC, the global warming potential (GWP) of CH4 emissions is 84-86 times higher than CO2 emissions over 20 years.
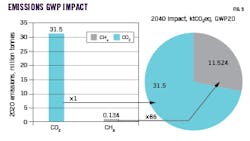
The outsized warming potential of CH4 emissions is evident from comparison of the 2040 GWP of the recent 2020 emissions of CH4 and CO2 (Fig. 5).
Analysis indicates that the 2040 impact of 2020 emissions of CH4 is more than a third of the CO2 impact even though the actual volume of CH4 emissions is only a small fraction of CO2 emissions in 2020. In 2020, global energy-sector CH4 emissions reached 134 million tonnes (Mt), estimated to be the highest level of global emissions of the gas in more than 800,000 years, according to IEA.4 Energy-sector 2020 CO2 emissions were 235 times greater at 31,500 Mt. The outsized GWP of CH4 implies that in 2040 its emissions impact would be equivalent to 11,524 Mt, or more than 36% the impact of CO2.
Methane emissions measurement
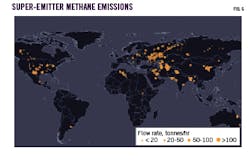
In addition to the outsized global warming impact of CH4, the proliferation of CH4 monitoring technologies from satellites, aircraft, drones, and ground-level sensors presents a stark picture of the scope and severity of CH4 emissions from the energy sector. In the US, the Environmental Defense Fund began publishing estimates of CH4 emission from the oil and gas sector that are 60% higher than official estimates from the Environmental Protection Agency (EPA). Similarly, global satellite imagery, like that from data analytics firm Kayrros (Fig. 6), reveals that global CH4 emissions are a larger and more widespread problem than previously understood.
Methane mitigation imperative
The snowballing information on CH4 emissions presents a formidable array of new opportunities and problems regarding mitigation of GHG emissions, and the outsized GWP for CH4 over the next two decades makes addressing this an essential cornerstone of the GHG mitigation strategy to avoid the worst effects of climate change.
Efforts to target CH4 emissions took center stage during the 26th Conference of the Parties (COP26) in Glasgow, Scotland, November 2021. The conference’s second day was dubbed “Methane Day,” and 130 countries announced their participation in the Global Methane Pledge to reduce CH4 emissions by 30% by 2030. The pledge is non-binding, but it represents the wide global consensus on the need to reduce CH4 emissions through concerted international action.
The Global Methane Pledge has intensified efforts by authorities in the US, EU, and other markets to regulate key sources of methane emissions throughout energy supply chains, as well as the emissions intensity of energy imports.
In the US, regulations introduced by the EPA would reduce energy sector CH4 emissions by 75%.5 In the EU, new legislation will establish requirements for upstream energy producers to reduce CH4 emissions through better leak detection and repair (LDAR) procedures and through monitoring, reporting, and verification (MRV) steps.6 Further, a new taxonomy for sustainable investment would require transparency of emissions throughout the energy supply chain, including for gas and LNG.
The political spotlight on CH4 pressures energy producers and consumers to do their part. For natural gas and LNG buyers and sellers, pressure from regulators and investors means that supply chain emissions are becoming as important as the price, flexibility, and reliability of supply.
Fortunately, abating CH4 emissions is not only urgent, but also is becoming technologically feasible and straightforward, more so than mitigating CO2. Thanks to the proliferation of satellite surveillance, aircraft-mounted detectors, drones, and ground level CH4 detection technologies, regulators and companies are increasingly able to detect, measure, manage, and verify or certify CH4 emissions.
These capabilities are beginning to create methane mitigation that captures or creates value for operators. Indeed, IEA estimates that some 75% of energy-sector CH4 emissions could be mitigated at little to no cost due to the commercial value of recovered CH4. Additionally, the new measurement technologies facilitate methods for verifying and commercializing higher value, reduced emissions natural gas and LNG. Early adopters of CH4 abatement in the US, which market their low-emission gas as responsibly sourced gas (RSG), report earning up to 5% above market prices, or $0.15/MMbtu.7
Emissions intensity, supply competition
To date, the “carrot” of methane commercialization at prevailing natural gas prices has not compelled suppliers to abate CH4 emissions with urgency. And the new policy “sticks” of regulatory controls and fees on CH4 emissions may not be applied equally (or at all) to global gas and LNG suppliers outside the US and EU.
Even so, the mounting importance and value of CH4 abatement for supply competition might well incentivize and stimulate rapid CH4 abatement activity as emissions become increasingly central to the commercial competition between sources of natural gas and LNG supply, and the pricing and value of that supply.
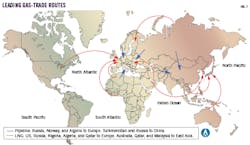
Fig. 7 illustrates the routes for which CH4 emissions intensity is estimated.
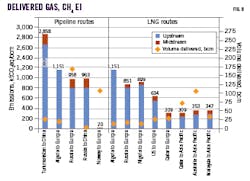
For the deliveries via each route in 2020, we analyzed CH4 emissions per unit of volume produced and delivered for each of the key upstream and midstream supply chain segments, respectively. For each of the pipeline and LNG supply routes, Fig. 8 presents the 2020 delivered volumes (the gold diamonds, right axis in bcm) and the per volume unit CH4 emissions (stacked bars, left axis, in kt CO2eq/bcm).
For both pipeline and LNG routes, upstream refers to oil and gas exploration and production and midstream refers to the part of the supply chain at which gas or LNG is transported to the relevant point of import. For pipeline routes, we assume that gas production is directly connected to a transportation pipeline to the point of import in the destination region or country. For LNG routes, we assume that gas production occurs within the vicinity of the liquefaction plant and that the gas is transported via pipeline from production to liquefaction. We consider the end of the LNG route to be just after regasification.
Analysis yielded two clear conclusions:
- The intensity of CH4 emissions from exploration and production of natural gas dwarfs the emissions intensity of the midstream segment, irrespective of the natural gas or LNG delivery route.
- Upstream CH4 emission intensity differs significantly between pipeline gas and LNG suppliers. On the extreme high end of the spectrum, Turkmenistan exhibits the highest upstream CH4 emission intensity among the pipeline routes, estimated at more than 2,600 kt CO2eq/bcm. This is almost three times higher than the average of second-tier contributors Algeria, Russia, and Nigeria (1,433, 796, and 843 kt CO2eq/bcm, respectively) which are all well above most of the other supply countries analyzed. Norway’s ultralow emitting North Sea fields are at the bottom of the list (14 kt CO2eq/bcm) and upstream natural gas production in Qatar, Australia, and Malaysia also exhibit low CH4 emission intensity (239, 258, and 269 kt CO2eq/bcm).
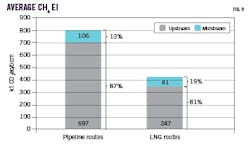
Fig. 9 presents the weighted average CH4 EI for all the pipeline and LNG routes previously analyzed, considering the volume of import along each. The results primarily reflect the much higher upstream CH4 emissions intensity of the producing countries feeding into the leading international pipeline routes. Midstream CH4 emissions intensity of pipeline routes also tends to be greater than for LNG.
These CH4 EI results may seem counterintuitive because they are the inverse of CO2 EI of natural gas and LNG midstream emissions. Fig. 4 shows that the CO2 EI of LNG is higher than that of pipeline gas due to the energy intensive nature of LNG liquefaction, shipping, and regasification. For CH4, however, the relatively newer LNG infrastructure and associated upstream gas sources have, as a rule, lower emissions intensities than the pipeline routes serving major European and Asian markets. There are clear outliers, of course, and Norway’s ultralow emitting North Sea gas field and pipeline system demonstrate that a commitment to CH4 emissions abatement can dramatically reduce emissions throughout the upstream and midstream supply chain.
Pricing, value implications
High global prices have yet to spur substantial progress towards CH4 abatement. While the rising popularity of some measures, including certification of low-emission gas and LNG supply, coincides with high global prices, producer participation in these practices remains selective. In the US, low-emission gas certification has been pursued largely on an opportunistic basis by companies whose emissions are already low. High prices have yet to drive substantial certification and abatement activity among producers with large emissions footprints.8 Explicit incentives and disincentives—in the form of emissions fees, emissions taxes, or emissions mitigation price premia or penalties—are still needed to achieve the scale of abatement required to mitigate climate change.
Governments and natural gas and LNG buyers, sellers, and producers are exploring measures to assign a value to CH4 emissions, as many have already done for CO2 emissions. The GHG intensity of imports by European and East Asian buyers is becoming a critical component of procurement decisions, second only to delivered prices. Therefore, the delivered pricing and GHG intensity of natural gas and LNG supply chains will be critical selling points for natural gas and LNG exporters.
To address the GHG mitigation imperative of the natural gas industry, efforts are already underway to measure CO2 and CH4 emissions, establish a value for their abatement, and factor this value into LNG-pricing practices and cargo disclosures. A framework put forward by the International Group of Liquefied Natural Gas Importers (GIIGNL) in November 2021 creates standard processes for reporting life-cycle GHG emissions, committing to abating those emissions, and offsetting the remainder.
Comprehensive measuring and monitoring for CH4, much like CO2, coupled with rising global awareness about the urgency of CH4 emissions mitigation, elevates the possibility that CH4 could be roped into existing CO2 emissions trading schemes, such as the EU’s Emissions Trading System. At present, no CO2 taxing or trading scheme includes CH4 (on a CO2 equivalent basis), but the expansion of those regimes to include CH4 emissions is a function primarily of data quality and political will.
Other voluntary and regulatory measures are gathering momentum, including:
- Certified Responsibly Sourced Gas (RSG). Some producers have begun efforts to mitigate CH4 emissions to obtain RSG certification, and a price premium of 5-10% has been reported.
- Social cost of methane. The US government estimates a social cost for key greenhouse gases, including CO2 and CH4 which reflects present-day value of future social, health, and economic costs attributed to climate change. The cost of a ton of emitted methane is $1,756, though the social cost is primarily a regulatory tool and has not been used in commercial settings to date.
- Methane fee. A fee under consideration by the US Congress would increase the cost of methane emissions from $900/ton emitted in 2023 to $1,500/ton in 2025.
References
- IEA, World Energy Outlook, 2020 Edition, Stated Policies Scenario, 2019-30 demand growth and capacity forecast, October 2020.
- IEA, Average Annual Capacity Factors by Technology, last updated Mar. 6, 2020.
- IEA, Renewables 2021 Outlook, December 2021.
- IEA, Methane Tracker, accessed October 2021.
- The White House, “Fact Sheet: President Biden Tackles Methane Emissions Spurs Innovations, and Supports Sustainable Agriculture to Build a Clean Energy Economy and Create Jobs,” Nov. 2, 2021.
- European Commission, “Commission proposes new EU framework to decarbonise gas markets, promote hydrogen, and reduce methane emissions, Dec. 15, 2021.
- Hampton, L. and Disavino, S., “US natural gas producers hope customers will pay more for ‘green gas’,” Reuters, June 30, 2021.
- Freitas, G., “’Responsibly Sourced’ Gas Finds a Niche, But Some Cry Greenwashing,” Bloomberg, Jan. 19, 2022.
The authors
Chris Goncalves ([email protected]) is a managing director and chair of Berkeley Research Group (BRG) LLC’s energy & climate practice, with 32 years of international experience in the energy and financial industries. He is a member of the International Association of Energy Economics. Goncalves earned a BA (1989) in international relations from Brown University, Providence, RI, and an MA (1993) in international economics from Johns Hopkins University, Baltimore, Md.
Athanasia Arapogianni ([email protected]) is an associate director of BRG’s energy & climate practice, with 12 years of international experience in the energy industry. Arapogianni earned and MSc (2008) in mechanical engineering from National Technical University of Athens and an MSc (2010) in renewable energy from University of Oldenburg, Germany.
Joanna Martin Ziegenfuss ([email protected]) is an associate director in BRG’s energy & climate practice with more than 14 years of market, commercial, and technical experience in the global energy industry. She is a member of the US Association of Energy Economics. Martin Ziegenfuss earned a BSc in marine biology from University of Wales, an MSc in marine and fisheries science from University of Aberdeen, a post-graduate certificate in project finance from Middlesex University London, and and MBA in strategy, economics, and finance from Cranfield School of Management, England.
Katie Bays ([email protected]) is a senior managing consultant at BRG. Bays earned BSc degrees (2010) in economics and Japanese from the University of Minnesota.
