Oil market outlook improved, uncertainties remain
As the world economy and travel demand are set for a meaningful recovery in 2021 driven by COVID-19 vaccines, the outlook for the oil market is improving.
The global oil market balance has shifted from a surplus in first-half 2020 to a deficit in second-half 2020, and it will likely continue through 2021. To achieve stable/rising oil prices, assertive rational guardianship from the Organization of the Petroleum Exporting Countries and allied oil producers including Russia (OPEC+) will continue to be needed.
Despite further lockdowns due to a more contagious COVID-19 strain in the UK and high hospitalization rates, the global economy is expected to recover synchronously in 2021 with vaccine distribution and fiscal and monetary support. The oil market in 2021 will also benefit from higher inflation. However, vaccine distribution and the resulting impact of consumer behavior changes on oil demand will take time to materialize.
The positive demand factors could be partly counteracted by uncertainties on the supply side. OPEC+ agreed to restrainedly increase collective oil output by 500,000 b/d from January 2021 and will meet monthly thereafter to discuss further adjustments. However, there are rising undercurrents within the consortium.
Exempt from the cuts, Libya’s production has been ramping up sharply since September, which caught many by surprise. With Joe Biden’ victory in the US presidential election and renegotiation of the Iran Nuclear Deal, there is the possibility that up to 2 million b/d of Iranian supply could come back online. In the US, the number of oil-directed drilling rigs and well completion activities have increased in response to higher prices.
Moreover, global spare production capacity is currently hovering around the highest level on record. According to Simmons Energy’s estimates, the current spare capacity of the OPEC+ consortium is near 12 million b/d. When one weaves in Canada, it approaches 13 million b/d. An ultimate normalization of spare production capacity in response to higher oil prices would put a cap on a rebound of oil prices.
Economic outlook, vaccines
Vaccination campaigns carried out in several countries and the expected widespread use of vaccines have raised expectations that global economic activity may return to normal relatively quickly in most regions.
According to most epidemiologists, the critical objective is immunization of 60-70% of the population. The US should have sufficient vaccines to target herd immunity mid-2021, according to analysis by science information and analytics company Airfinity. The UK and the EU should achieve the goal sometime in the summer or fall.
Recent economic indicators show that economic growth in most countries/regions rebounded sharply in third-quarter 2020 after a sharp decline in the second quarter. The RWI/ISL index, which tracks global container movements, increased by 6.6% year-on-year in October 2020. The CPB index shows that the year-on-year gap of industrial production and world trade in September 2020 has narrowed to 2%. Nevertheless, these indicators don’t reflect new COVID-19 containment measures seen in the fourth quarter.
The global purchasing managers’ index (PMI) reached 53.3 in October 2020, its highest level since August 2018, then declined to 53.1 in November due to rising COVID-19 cases. The Eurozone economy fell back into a broad contraction in November and December. However, broad business sentiment for the year ahead increased on positive vaccine news.
Most economic forecasters now predict that global GDP will return to pre-pandemic levels by the end of 2021. While possible rising COVID-19 cases in early 2021 would continue to require social distancing measures and restrictions on travel, industrial activity may recover relatively quickly to support diesel demand, but the service industry, especially tourism, will continue to suffer losses.
Meantime, there is a strong case for the return of inflation post COVID-19, especially in the US. With a focus on labor market and low-income households, future accommodative fiscal and monetary stimuli are expected. Commodities prices typically rise when inflation is accelerating.
World oil demand
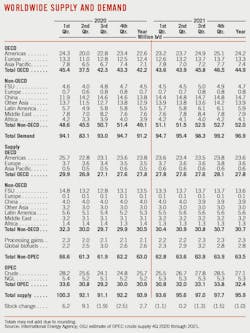
Preliminary data from the International Energy Agency (IEA) shows that global oil demand declined by 8.82 million b/d (-8.8%) in 2020. The locus of the demand weakness has been within OECD. Oil demand in OECD countries decreased by 5.55 million b/d in 2020 year-on-year, or 11.64%, while non-OECD demand was down 6.25%.
Demand in OECD Europe contracted by 1.83 million b/d year-on-year, or 12.84%; demand in Japan declined by 10.14%. OECD America demand dropped by 3 million b/d, nearly 12%. US demand declined by 2.4 million b/d, or 11.6%.
In non-OECD countries, China’s demand grew by 120,000 b/d in 2020, helped by a remarkable pandemic recovery. Demand in India dropped by 440,000 b/d in 2020.
Although the winter COVID-19 surge is currently reducing mobility and oil consumption, the Pfizer and Moderna vaccines should gradually promote normalization over the course of next 2 years, especially the second half of 2021 and 2022.
According to IEA’s latest forecasts, oil demand will climb by 5.7 million b/d in 2021 and recover to nearly 97% of the 2019 level overall.
OECD demand is expected to expand by 2.8 million b/d in 2021 and is set to recover to close to 95% of the 2019 baseline by second-half 2021. Demand in OECD Americas will expand by 1.61 million b/d, or 7.12%, this year. OECD European oil demand will expand 7.17% to 13.31 million b/d this year, according to IEA forecasts.
Non-OECD oil demand will expand by 2.9 million b/d this year and is expected to recover to 2019 baseline by mid-2021. Oil demand in China is expected to average 14.67 million b/d this year, up 6% from last year. India oil demand is expected to average 5.06 million b/d this year, an expansion of 8.3% over 2020.
By product category, global gasoline demand will likely recover to the 2019 baseline by 2022 as non-OECD demand growth offsets a continued drop-off in OECD demand. Global distillate demand is expected to recover to the 2019 baseline in 2021 and to overtake the baseline by 2022, thanks to increased industrial activity.
Global jet fuel demand recovery is expected to improve; however, it remains a significant obstacle to a broader recovery. The International Air Transport Association (IATA) expects air passenger demand to be roughly 60% of 2019 levels in 2021.
World oil supply
OPEC crude production was 25.7 million b/d in 2020, down nearly 3.5 million b/d from 2019, with Saudi Arabia making the largest reductions, according to latest IEA data and OGJ estimates.
OGJ forecasts OPEC crude oil production will average 27.1 million b/d in 2021, reflecting OPEC’s announced potential increases to production targets and production increases in Libya.
Exempt from the OPEC+ cuts, Libyan crude output posted a meteoric rebound since September after a cease-fire agreement. Libyan overall supply topped 1 million b/d in November 2020, up from a low of 140,000 b/d in September.
Oil supply of non-OPEC countries, averaging 63 million b/d in 2020, was 2.6 million b/d lower than a year ago, according to IEA. The decline of production from the US, Russia, and Canada offset the increase of Norway and Brazil production. Total non-OPEC oil supply is expected to grow 500,000 b/d in 2021 in response to higher oil prices.
A recovery in oil prices since May 2020 has encouraged US onshore operators to bring back some shut-in wells and restore some drilling activity. US crude oil production is now expected to decline by 900,000 b/d in 2020 and by a smaller 350,000 b/d in 2021 as declining production at existing wells outpace production from newly drilled wells in the coming months. US NGLs, contrary to crude, posted strong growth in 2020.
Excluding the US, the projected international non-OPEC production growth over 2021 is driven by Russia and Canada normalizing and gains from Brazil and Norway.
Russia’s oil production dropped to 10.59 million b/d in 2020 from 11.58 million b/d in 2019. Production in 2021 is forecast to rise 1.13% to 10.71 million b/d. According to Deputy Prime Minister Alexander Novak, Russian oil companies are ready to increase oil production by 125,000 b/d starting in January 2021.
Due to shut-ins and steep cuts in capital expenditure plans, Canadian oil production in 2020 decreased 4.9% year-on-year to 5.27 million b/d. Canadian oil production had been continuously recovering since August 2020. The country’s production is expected to grow to 5.56 million b/d in 2021.
Johan Sverdrup field came online in late 2019, aiding in the 15.52% increase of Norwegian oil production in 2020 to 2.01 million b/d. The country’s production is expected to rise further to 2.17 million b/d this year, as government mandated production restrictions lapse, capacity from Johan Sverdrup increases, and the Snorre expansion project comes online earlier than expected.
Brazil’s total oil production increased 5.17% to 3.05 million b/d in 2020 from 2.9 million b/d in 2019 thanks to strong investment and boosted production from the presalt horizon. The country’s production is expected to climb 6.56% to 3.25 million b/d in 2021. In an updated business plan, Petrobras cut its 5-year investment budget by 27% from a year ago to $55 billion to preserve cash. The company plans to focus on the deepwater oil fields in the Santos basin presalt and sell non-core assets to reduce debt.
China’s oil production rose to 3.98 million b/d in 2020 from 3.92 million b/d in 2019. China’s oil production in 2021 is forecast to decrease 1.26% to 3.93 million b/d.
OECD stocks
In October 2020 (the latest data available), total OECD industry stocks fell for the third consecutive month to 3,128 million bbl. Stocks reached their peak in July (3,221 million bbl) and drew by 92.4 million bbl (1 million b/d) over the August to October period.
With a stock build of 325 million bbl (1.79 million b/d) over first-half 2020, at end-October the inventory remained 183.4 million bbl above the 5-year average.
With expected demand recovery, global crude inventories are set for consistent inventory draws through most of 2021. With OGJ forecasts of OPEC crude production in 2021, global oil stock is expected to draw 1 million b/d during 2021, which could support stable/rising oil prices. OGJ currently predicts a $55/bbl Brent in second-half 2021.
US oil demand
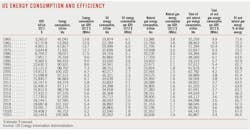
Due to the COVID-19 pandemic and containment measures, US oil consumption was estimated to have averaged 18.16 million b/d in 2020, compared to 20.54 million b/d in 2019, a decrease of 11.6%.
OGJ forecasts that total US oil consumption will average 19.65 million b/d in 2021, an increase of 1.5 million b/d (+8.2%) from the 2020 level, which is about 96% of the 2019 level.
Estimated US motor gasoline consumption averaged 8.09 million b/d in 2020, down 13.1% from 9.3 million b/d in 2019. During the first 10 months of 2020, vehicle miles travelled (VMT) decreased 14.53% y-o-y, as reported by the US Federal Highway Administration. OGJ expects that gasoline consumption will increase 7% in 2021 to around 8.65 million b/d, supported by a recovery of traffic demand.
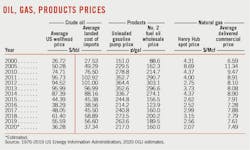
US regular gasoline retail prices averaged $2.17/gal in 2020, compared to $2.60/gal in 2019. In 2021, retail gasoline prices are forecast to climb to $2.27/gal.
US distillate fuel consumption declined by an estimated 310,000 b/d (-7.56%) in 2020. OGJ forecasts that US distillate fuel consumption will grow by over 5% in 2021, backed by increased industrial and manufacturing activity.
US consumption of jet fuel averaged 1.09 million b/d in 2020, down 37.36% from 1.74 million b/d a year ago. IATA reported US revenue passenger miles (RPM) over the first 9 months of 2020 were 64% lower compared to the same period a year ago. OGJ forecasts that US consumption of jet fuel will expand around 40% to around 1.5 million b/d in 2021, which is still well below the 2019 level.
Demand for HGL averaged 3.12 million b/d in 2020, largely unchanged from a year ago. OGJ forecasts that demand for HGL will rise by 7% in 2021.
US oil production
Higher crude oil prices since May 2020 fueled increased drilling and fracturing activity in the US shale patch. According to Baker Hughes data, the oil rig count recovered to 258 for the week ended Dec. 11, 2020, from a record low of 172 in August 2020—still well below the 667 oil rigs counted during the same year-ago period. The number of wells completed also increased.
Gulf of Mexico oil production in 2020 experienced extensive storm shut ins from August to October. Output from the Gulf of Mexico is estimated to average 1.69 million b/d in 2020, down from 1.9 million b/d in 2019.
Overall, US crude oil production in 2020 is estimated to average 11.34 million b/d, a drop of 910,000 b/d (-7.43%) in 2019.
Driven by the oil price collapse earlier in 2020, US producers have begun to consolidate and accelerate mergers and acquisitions. Many of these transactions were low premium stock-for-stock deals, which suggests a desire to keep debt levels low and avoid post-deal deleveraging issues. Notable transactions include Chevron’s acquisition of Noble Energy and ConocoPhillips’ acquisition of Concho Resources.
With the current low oil price environment, strict capital disciplines remain. The preliminary 2021 guidance summary, based on US companies’ third-quarter earnings reports, shows that public tight-oil focused producers are targeting only to maintain activity levels.
Moreover, as Chapter 11 filings by US exploration and production companies continue, onshore oil production from companies that filed for bankruptcy in 2019-2020 is set to decrease by about 25% by the end of 2021, or by about 200,000 b/d compared to current output levels, according to Rystad Energy analysis. The loss could offset production growth elsewhere.
Overall, with continued capital discipline and as declining production rates at existing wells outpace production from newly drilled wells in the coming months, OGJ forecasts US crude oil production to slide further to 11 million b/d in 2021, while slight growth is expected in 2022.
Nevertheless, in late 2021, nationwide drilling activity may meaningfully recover in response to higher oil prices. Meantime, a quicker recovery in completions activity is anticipated due to the substantial inventory of drilled but uncompleted horizontal wells across the major basins.
US NGL production continued to climb in 2020 as ethane extraction rose to record levels with the widening of the oil premium to natural gas prices. US NGL production grew 5.7% in 2020 to 5.1 million b/d and will increase 3.5% to 5.28 million b/d this year, OGJ forecasts.
Collectively, US oil supply in 2021, including crude oil and NGL, is expected to decrease 1% further to 16.28 million b/d.
US refining
In 2020, the refining industry faced unprecedented weakness in oil demand, especially in products with higher profit margins. Difficulties adjusting production capacity resulted in excess refined oil inventory (primarily distillate fuel and motor gasoline) for a large part of the year. These weighed on refining utilization and margins.
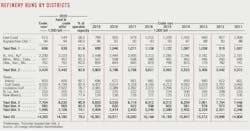
Gross inputs to US petroleum refineries, or refinery runs, averaged 14.78 million b/d in 2020, down 13% from the previous year. Refinery utilization as a percentage of operable capacity averaged 79.2% in 2020, down from 90.3% in 2019.
US refining capacity reached a record high of nearly 19 million b/cd earlier in 2020, but several refineries have since closed, and capacity fell to the lowest level since May 2016. The Philadelphia Energy Solutions refinery in Pennsylvania (335,000 b/cd) closed in May. Operable capacity fell another 19,000 b/cd in June when Marathon’s refinery in Dickinson, North Dakota, closed to be converted to a renewable diesel plant. The further decline in operable capacity reflected three recent refinery closures in Wyoming, California, and New Mexico. Two of them are planned for a conversion to renewable diesel production.
Refining cash margins for the first 10 months of 2020, the latest data available, averaged $6.89/bbl for the Midwest, $6.97/bbl for the West Coast, $2.32/bbl for the Gulf Coast, and $1/bbl for the East Coast, according to Muse Stancil & Co. These were down dramatically from regional cash refining margins of $16.92/bbl, $14.82/bbl, $6.04/bbl, and $2.94/bbl respectively in 2019.
With progress on COVID-19 vaccines and more capacity closures, refining outlook is turning more positive. However, US oil refining activities are not expected to fully recover by 2022, not only due to demand development, but also due to higher maintenance outages to compensate for the work cancelled in 2020. Although near-term spot margins are likely to remain challenged by weak demand, the case is building for a rally in deferred margins.
Oil trade
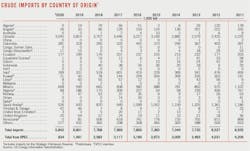
US crude oil exports reached 3.1 million b/d in 2020, an increase of nearly 4% from 2019, according to OGJ estimates. The increase reflected international purchases incentivized by low oil prices and falling VLCC freight rates.
Due to high crude oil inventories and reduced US refining activities, US crude imports averaged 5.84 million b/d in 2020, down over 14% from the 2019 average of 6.8 million b/d. Hence estimated US crude net imports reduced to around 2.74 million b/d in 2020 from 3.82 million b/d a year ago, a decrease of 28%.
Product imports in 2020 declined an estimated 14.3% year-on-year, reflecting lower product demand and high inventories.
Product exports over first-quarter 2020 averaged 6 million b/d, up 13.3% from first-quarter 2019. However, product exports dropped dramatically since then due to COVID-19 restrictions and lower international demand. Product exports over 2020 were estimated at 5.4 million b/d, down 2% year-on-year, led by declines in distillate and gasoline exports. However, HGL exports continued to grow strongly in 2020. Over the first 9 months of 2020, HGL exports averaged 2.05 million b/d, an increase of 280,000 b/d (+16%) compared with the same period of 2019. The top destination for US HGL exports was Japan.
Oil stocks
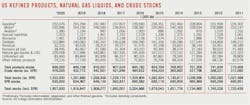
As the pandemic crushed demand, monthly end-of-period commercial crude oil inventory (excluding the Strategic Petroleum Reserve) averaged 494 million bbl throughout 2020, compared to an annual average of 449 million b/d in 2019. In June 2020, it reached a record high of 532 million bbl. Commercial oil stock is expected to close out 2020 at 476 million bbl, 9.9% higher than the year-ago level.
Monthly end-of-period product stocks averaged 883 million bbl through 2020, compared to an average of 833 million bbl during 2019. Averaged distillate fuel inventories were 156.9 million bbl, 18.5% higher year-on-year.
However, due to refinery capacity closures and rebounding demand later in the year, product stocks fell rapidly at yearend. Total estimated petroleum stocks stood at 846 million bbl at yearend 2020, down 0.3% from a year ago. Motor gasoline inventories finished 2020 at 241 million bbl, compared to 254 million bbl at yearend 2019. Jet fuel stocks moved 7% lower to 37.7 million bbl, and inventories of residual fuel oil finished 2020 lower by 6.9% to 28.4 million bbl.
Crude inventories in the Strategic Petroleum Reserve were 635 million bbl at yearend 2020, the same as yearend 2019.
US natural gas
Henry Hub spot gas prices reached a record low of $2.07/MMbtu in 2020, compared with $2.57/MMbtu in 2019, and $3.15/MMbtu in 2018. In 2021, gas prices are expected to rebound above $3/MMbtu on a tightening market with dramatic decline in gas production and higher exports demand.
Weighted by negative impacts of COVID-19 and warmer winter weather early in the year (January-March), estimated US natural gas consumption in 2020 dropped by 2% compared with the previous year, averaging 83.41 bcfd, according to EIA data.
Despite lower total gas consumption, the electric power sector in 2020 consumed more gas thanks to record low gas prices. The sector consumed 31.56 bcfd of gas in 2020, accounting for 37.8% of total domestic gas consumption, compared to 30.9 bcfd in 2019. However, gas usage in the electric power sector is expected to decline in 2021, mainly reflecting higher gas prices.
As a result of lower manufacturing activity related to the COVID-19 pandemic, industrial natural gas consumption in 2020 decreased 2.34% compared to the 2019 level, averaging 22.55 bcfd. In 2021, OGJ expects industrial usage will grow slightly, thanks to mixed effects of increasing manufacturing activity and higher gas prices.
Due to warmer winter weather early in the year and closures of restaurants and stores during lockdown periods, residential and commercial gas consumption in 2020 decreased 5.6% and 10.7% respectively compared with their 2019 levels. In 2021, residential consumption will increase with colder weather during the 2020-21 winter (the National Oceanic and Atmospheric Administration forecasts a 5% increase in heating degree-days for the 2021 heating season compared to 2020 for the US as a whole). Behavior changes in reaction to the pandemic, including work-from-home and virtual schooling, will also increase residential space heating demand this winter. Commercial gas consumption in 2021 will increase strongly with an expected return to normal commercial activities.
All in, US natural gas consumption in 2021 is expected to drop 2.9% from a year ago, averaging 81 bcfd, OGJ forecasts. The decrease is mainly driven by lower demand in the electric power sector due to higher gas prices.
With less drilling and associated gas production cuts after the COVID-19 outbreak, US gas production recorded the first decline since 2016. Total marketed production and dry natural gas production were 98.4 bcfd and 90.88 bcfd in 2020, down 1.6% and 2.3% respectively from a year earlier. The US gas-directed rig count fell to 68 in July 2020 from 123 at the start of the year and rebounded modestly to 79 by the week ended Dec. 11, 2020.
In 2021, despite the upcoming market tightness, gas producers’ ability to proactively increase capex is slim due to balance sheet stress and limited access to capital. OGJ forecasts that US marketed gas production will decline further to 95.8 bcfd in 2021.
According to EIA data, US net gas exports averaged 7.55 bcfd in 2020, up 44% from 5.24 bcfd a year ago, and was equivalent to 8.3% of total US dry gas production.
Global gas oversupply in 2019-2020 led to substantial cancellations of US LNG exports over the summer of 2020, peaking at 45 cargo cancellations in July. US LNG exports have since increased as international natural gas and LNG prices increased in Asia and Europe after COVID-19 restrictions were eased and global LNG supply fell due to unplanned outages in major producing countries. In contrast, 2.7 bcfd of new US LNG export capacity was added in 2020. While several LNG terminals were affected by hurricanes, shipments soon resumed.
In November, estimated LNG exports surpassed the previous record set in January 2020. According to EIA data, November US LNG exports reached 9.4 bcfd, which was 93% of peak LNG export capacity utilization. For 2020 as a whole, estimated LNG exports averaged 6.53 bcfd, 31% higher than in 2019. In 2021, LNG exports will continue to increase dramatically with increased exporting capacity.
During the first 9 months of 2020 (the latest data from EIA), Mexico imported 5.36 bcfd of US natural gas by pipeline, compared to 5.11 bcfd averaged for the whole year of 2019. US natural gas exports to Canada through pipeline averaged 2.4 bcfd during the first 9 months of 2020, compared with an annual average of 1.9 bcfd in 2019.
Net additions to working natural gas inventories totaled 1,914 bcf during the 2020 injection season, about 2% less than the 5-year average and 23% less than the near-record net injections of 2,571 bcf reported during the 2019 injection season, reflecting slowing natural gas production throughout 2020. However, with a high starting level in April, the amount of working natural gas in storage ended the 2020 injection season at 3,951 bcf, which was still well above the 5-year average level.
About the Author
Conglin Xu
Managing Editor-Economics
Conglin Xu, Managing Editor-Economics, covers worldwide oil and gas market developments and macroeconomic factors, conducts analytical economic and financial research, generates estimates and forecasts, and compiles production and reserves statistics for Oil & Gas Journal. She joined OGJ in 2012 as Senior Economics Editor.
Xu holds a PhD in International Economics from the University of California at Santa Cruz. She was a Short-term Consultant at the World Bank and Summer Intern at the International Monetary Fund.
Laura Bell-Hammer
Statistics Editor
Laura Bell-Hammer is the Statistics Editor for Oil & Gas Journal, where she has led the publication’s global data coverage and analytical reporting for more than three decades. She previously served as OGJ’s Survey Editor and had contributed to Oil & Gas Financial Journal before publication ceased in 2017. Before joining OGJ, she developed her industry foundation at Vintage Petroleum in Tulsa. Laura is a graduate of Oklahoma State University with a Bachelor of Science in Business Administration.
