Research addresses high-voltage interference, AC corrosion risk for cathodically protected pipelines
Research addresses high-voltage interference, AC corrosion risk for cathodically protected pipelines
Based on a presentation to the 6th International Conference on Pipeline Rehabilitation & Maintenance, Berlin, Oct. 6-10, 2003.
Buried pipe- lines that parallel high-voltage lines are inductively interfered with by the lines' operating and fault currents. As a result, the AC-potential pipe-to-ground increases, with consequences for the safety of the pipeline against hazardous shocks and AC corrosion where the coating has been damaged.
With reference to practical examples, this article describes calculations and measurement techniques for evaluating inductive high-voltage interference of pipelines and presents factors that govern the interference level. Where thresholds are exceeded, countermeasures are required to protect personnel or prevent corrosion.
The article also addresses the assessment of pipeline-corrosion risk from AC. Current state of the art is to use coupons, which simulate a coating fault. This practice permits measurement of AC current density and evaluation of corrosion products and pits.
Recently different criteria to assess AC corrosion risk have been proposed that are based on the ratio between AC and DC current densities or the instantaneous off-potential (high speed off-potential measurement) measured on a coupon. These criteria are discussed in light of results of laboratory investigations with coupons under the load of different AC voltages and different levels of applied cathodic protection. The results suggest that a careful adjustment of the CP level, providing relatively low CP-current densities in coating faults (while considering the need for adhering to the relevant CP standard) are helpful in achieving low AC corrosion rates.
Site influenced
Oil and gas transmission pipelines frequently parallel or run near high-voltage lines (e.g., 50 hz frequency). As a result, the pipeline may experience inductive interference from the electro-magnetic field. From the pipeline operation point of view, the most important types of interference are:
Inductive interference due to operating currents in the high-voltage line. This results in a pipe-to-ground potential (Uac) that may exceed the given threshold for personnel safety.
In Germany, the threshold is 65 v.1 Furthermore Uac causes an AC-current density (Jac) in any coating fault where the pipeline steel surface contacts the surrounding soil, which may result in corrosion if Jac>30 amp/sq m.2
null
Inductive interference due to fault currents in the high-voltage line. Provided the duration of fault current is smaller than 0.5 sec, the threshold is Uac = 1,000 v.2
This article presents two examples of inductively interfered with pipelines and describes the measures that had been taken to reduce Uac. Further presented are some results regarding AC corrosion followed by considerations for appropriate corrosion-protection measures.
The focus is on interference from operating currents in the high-voltage line. But one example regarding interference from fault currents will be presented to show that calculation methods are well suited to evaluate the expected Uac, e.g., during the planning phase of a new pipeline.
Evaluation of Uac
The evaluation of Uac is generally based on the calculation of the induced longitudinal field strength (E) for a segment of the pipeline.1 E is:
The value and frequency of the inducing current.
The mutual inductance, related to the unit length, between the conductor(s) of the high-voltage line and the pipeline, i.e., a function of their clearance and of the soil resistivity.
The reduction factor, allowing for the protective effect of adJacent earthed conductors.
For simplified conditions (e.g., parallel routing between high-voltage line and pipeline, uniform coating resistivity of the pipeline, constant soil resistivity, and both ends of the pipeline terminated by characteristic impedance), an analytical solution for Uac as a function of pipeline length may be evaluated.
Generally, however, these calculations are carried out by use of computers that take into account the relevant parameters of the high-voltage line and the pipeline:1
Drawings showing the routes of the high-voltage lines and the pipeline together with location of power stations, substations, transformer stations, overhead line towers, and pipeline stations.
- Rated voltage and type of system grounding of the high-voltage system.
- Inducing current of the high-voltage line; maximum working current.
- Form of towers and configuration of conductors.
- Diameter and coating resistivity (ru) of the pipeline.
- Reduction factor of the high-voltage line and, if necessary, of other reducing conductors.
Uac as a function of pipeline length (l) is then obtained from the vectorial sum of the induced voltage from each individual pipeline segment considered.
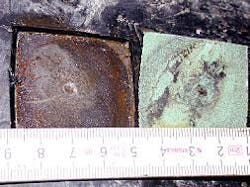
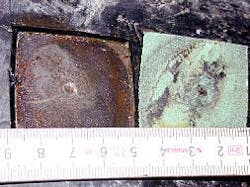
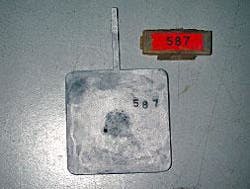
Coupon in above photo on the left from Location 4 (Example 2) appears after 2 years of installation: penetration rate 0.09 mm/year; pH on steel surface = 12; Uac = 3.9 v (mean level over 1 week); Uon = –2.8 v-3.6 v (due to DC stray current); and Uoff = –1.2 v (Fig. 5).
Excavated site in the above photo on the right shows corrosion on steel surface (Example 2): diameter 4 mm; depth 0.7 mm; penetration rate 0.3 mm/year; Uac = 3.9 v; Uon = –2.2 v-–3.5 v (due to DC stray current); and Uoff = –1.2 v (Fig. 6).
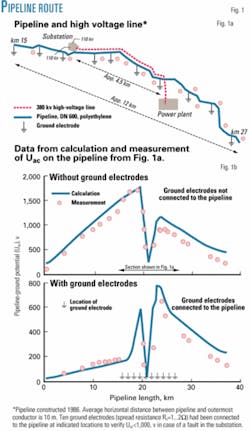
For practical reasons it is important to verify that Uac,calculated≈ Uac,measured, i.e., that a calculation of Uac appropriately mirrors practical conditions. For this purpose Fig. 1b shows data from calculation (line) and measurement (dots) of Uac from an inductively interfered pipeline section (Fig. 1a).
A test current (256 amp) had been injected into one conductor of the high-voltage line simulating a fault in the substation. With a slightly different frequency (f = 49.5 hz), it was possible to eliminate disturbing 50-hz interference. Uac had been measured at each CP test post indicated with black dots in Fig. 1a. The results of both calculation and measurement as shown in Fig. 1b had been extrapolated to the real expected fault current, i.e., 12.2 kamp. (See also Reference 3.)
The correspondence of calculated and measured data is reasonable. In the following, this result will be used as a basis for the interpretation of calculated pipeline-to-ground potentials (Uac).
First example
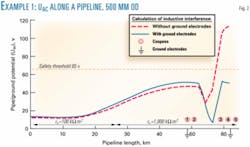
Fig. 2 shows the results of calculated Uac for a pipeline (500 mm; 20 in.) constructed in 1999. The pipeline is inductively interfered by four 50-hz high-voltage lines (110 kv/220 kv); the level of operating currents is between 520 and 960 amp. The expected coating resistivity was set to 1 MΩ sq m which is typical for polyethylene-coated pipelines. Another existing section of the pipeline was coated with 100 kV sq m (Fig. 2).
Installing two ground electrodes Uac is clearly below the safety threshold. In order not to interfere with the CP system, ground electrodes are electrically connected to the pipeline by antiparallel and unsymmetrical diodes.4 Cathodic protection was operated at about Uon = –2.7 v (with respect to a Cu/CuSO4-electrode).
In order to indicate if any AC-corrosion risk exists at coating faults, coupons had been installed—and electrically connected to the pipeline—at five locations (Fig. 2), which had been selected according to the maximum level of Uac and to the presence of low soil resistivity in swampy and humid areas. After an operating time of somewhat more than 2 years, the coupons were excavated at three locations. Table 1 gives the results.
The measured level of Uac is less than the calculated one, indicating a lower level of actual operating currents in the high-voltage lines compared to the maximum one which had been used for the calculation.
The values for Uon and Uoff indicate effective cathodic protection that is verified by pH>10 of any surface layers and/or corrosion product which had been found on the coupons.
The spread resistance varies among different test locations and also among the three coupons that were installed at one test site (see also Reference 6). It is interesting to note that spread resistance of coupons is relatively high at Location 4 and consequently Jac is low. The relatively high penetration rate, which had been found on coupons Nos. 777 and 778 may be due to a temporarily low spread resistance causing higher AC current densities at constant Uac.
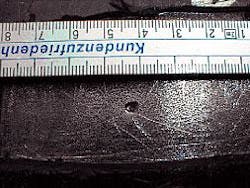
From these results it has been concluded that an AC-corrosion risk exists for the new pipeline section and IFO measurements (IFO = intensive coating fault location4) had been carried out to identify small coating faults on the pipeline. Fig 3 shows an excavated coating fault where the steel surface is slightly corroded, which had been located at km 64.045 (Fig. 2). This result confirms the conclusion from coupon measurements.
Second example
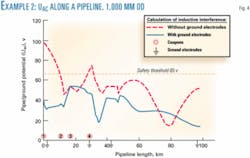
Fig. 4 shows the results of calculated Uac for a pipeline, DN 1,000, constructed in 1999. The pipeline is crossing or running parallel to eight 50-hz high-voltage lines (110 kv/380 kv), each contributing to Uac which is calculated as the geometrical sum of all individual interference voltages. The expected coating resistivity was set to 1 MΩ sq m.
Installing four ground electrodes Uac is clearly below the safety threshold. In order not to interfere with the CP system, ground electrodes are electrically connected to the pipeline by antiparallel and unsymmetrical diodes.4 Cathodic protection was operated at on-potentials varying between –1.6 v and –4.0 v (with respect to a Cu/CuSO4-electrode) due to interference from DC-operated electrified railways.
In order to indicate if any AC-corrosion risk exists at coating faults, coupons had been installed—and electrically connected to the pipeline—at four locations (Fig. 4) that had been selected according to the maximum level of Uac and to the presence of low soil resistivity in swampy and humid areas. After 2 years the coupons were excavated. Fig. 5 shows coupon No. 587 from Location 4 (Fig. 4). From these results, it had been concluded that an AC-corrosion risk exists for the new pipeline and IFO-measurements had been carried out to identify small coating faults.
Fig. 6 shows an excavated coating fault where the steel surface is slightly corroded, which had been located about 2 km apart from coupon No. 587. This result confirms the conclusion from coupon measurements.
Corrosion protection
The need for additional corrosion-protection measures is clearly indicated by both examples. As a guideline one may use criteria mentioned in Reference 7 to extract those parameters that have to be adjusted in order to achieve corrosion protection. The criteria are:
Criterion A:
Jac > 30 amp/sq m → corrosion risk high
Jac < 30 amp/sq m → corrosion risk low
Following this criterion, Uac should be reduced, for example, by installing additional ground electrodes. The effectiveness of this measure has been verified by several investigations5 7 8 and will not be discussed here.
Criterion B:
UIR-free < –0.85 v at any moment or UIR-free < –0.950 MΩ in anaerobic soil containing sulfate-reducing bacteria → corrosion risk low
Criterion C:
Jac/Jdc > 10 → corrosion risk high
3Jac/Jdc < 3 → corrosion risk low
Both Criteria B and C recommend increasing the CP-level in order to reduce the AC-corrosion risk. In case of Criterion B, the success of adjusting the on-potential more negative is to be measured with a specially developed high-speed potential measurement,9 but it has been shown recently that the results from this measurement technique do not allow a clear distinction between coupons that are corroding and those ones that do not corrode.10
Criterion C is interesting because, by establishment of the quotient Jac/Jdc, some generally unknown parameters, such as soil resistivity or (in case of real coating faults) the geometry of the bare steel surface, are eliminated, provided both current densities follow Ohm's law by using the spread and pore resistance of a coupon/coating fault and neglecting the nonlinear polarization resistance.
This has been demonstrated in Reference 5. Following this, Jac/Jdc may also be written as:
null
where:
UIR-free = the IR-free potential of the coupon/coating fault.
In case of polyethylene-coated pipelines with generally small coating faults, UIR-free.< Uoff may be assumed, thus neglecting a possible difference, e.g., 50-100 MΩ, between both values.
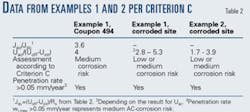
Table 2 shows data that have been evaluated from the figures presented in Examples 1 and 2.
Following the results of Table 2 one may consider adjusting the level of the CP systems (of both pipelines) to a slightly more negative level in order to avoid AC corrosion. It has been demonstrated in References 5 and 11, however, that increasing pH of that medium, which is in contact with the steel surface and which generally accompanies an increasing CP level, may accelerate AC corrosion.
In order to clarify this contradiction, laboratory experiments have been carried out. The results are as follows.
Corrosion rate
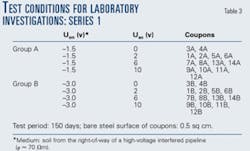
Table 3 describes the conditions for the first series of laboratory investigations. Coupons with a bare steel surface of 0.5 sq cm had been exposed to Uac = 0, 2, 6, and 10 v while two different CP potentials Uon = -1.5 v (Series A) and Uon = -3 v (Series B) had been applied. Soil had been taken from the right-of-way of a high-voltage interfered pipeline and the test period was 150 days.
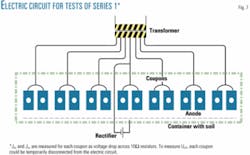
Fig. 7 shows the electric circuit.
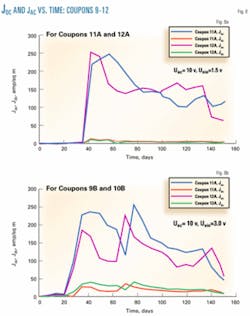
Fig. 8 shows plots of Jdc and Jac vs. time as measured for coupons. The sharp increase of current densities after 35 days (Fig. 7a) and 21 days (Fig. 7b) results from adjusting the "groundwater level" in the container to where coupons were installed.
The shapes of the curves in Figs. 7a and 7b do not significantly differ from each other, except regarding Jdc, which is higher for Coupons 9B and 10B (compared to Coupons 11A and 12A) due to Uon = –3 v.
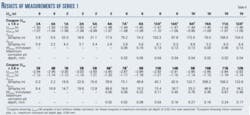
From the results of these measurements, average values (Jdc,av and Jac,av) have been evaluated, neglecting those data which had been obtained before adding "groundwater" to the container. Table 4 presents the results of all measurements of Series 1.
In Table 4 wl,max is the penetration rate as calculated from the deepest corrosion pit. Average values for Uon and Uoff had been calculated as described before for Jac. With reasonable accuracy Equation 1 may be verified.
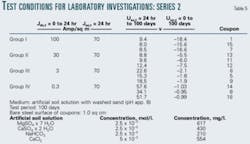
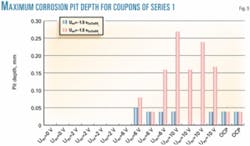
Fig. 9 compares the results from the measurements of corrosion pit depth for coupons of Group A (Uon = –1.5 v) with Group B (Uon = –3 v). It should be noted that maximum corrosion pit depth is lower for coupons operated at Uon = –1.5 v. Table 5 shows the test conditions for Series 2. For these investigations, coupons were initially (i.e. t = 0) polarized (galvanostatically) with Jdc between 0.3 and 100 amp/sq m followed (after 24 hr) by superposing Jac = 70 amp/sq m after 24 hr. From now on, Uon and Uac were kept constant (see Table 5).
It should be noted that Uac, needed to achieve Jac =70 amp/sq m, increases with decreasing Jdc, indicating an increasing spread resistance of coupons.
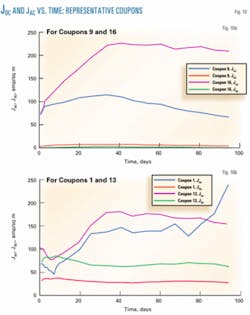
Fig. 10a and 10b show Jdc and Jac vs. time for one coupon out of each group and may be considered representative. Generally, Jac initially increases; after 50 days, however, there is a tendency to decreasing current densities.
Comparing the curves should note the different levels of Uac and Uon. After the test period of 100 days, coupons were removed and pH was measured on the steel surface followed by measuring the maximum corrosion pit depth from which the penetration rate (wl,max) was calculated.
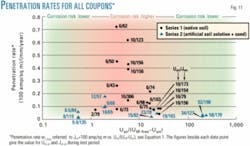
Table 6 shows the results from Series 2. It should be noted that Equation 1 is fulfilled within reasonable accuracy. Penetration rates are relatively low, even in case of relatively high Jac (Coupons 14 and 16). Fig. 11 shows penetration rates for all coupons (Jac,av > 30 amp/sq m) of Series 1 and 2. In order to be able to compare the data, penetration rates refer to Jac = 100 amp/sq m (which shall not imply a linear relation between wl,max and Jac).
Fig. 11 shows only one coupon from Series 1, which was operated at Uac = 2 v; corrosion rate is low, however. Enhanced corrosion rates are found for 1 < Uac/(Uoff–Uon) < 30 auf. The soil used as the medium in Series 1 may favor the corrosion rate compared to the "sand + artificial soil" solution, that was used in Series 2.
Results
The results from corrosion-rate measurements on coupons that had been exposed to constant AC voltage Uac at different cathodic protection on-potentials Uon point out that the level of Uon is an important factor that influences the corrosion rate.
It is assumed that alkalinity, which increases if Uon is adjusted to more negative levels, plays an important role.5 11
In contradiction to Criterion c, however, from which a continuously decreasing corrosion rate may be concluded if CP current density is increased whereby Uon will be more negative, the results presented here suggest:
Relatively low corrosion rate if Uac/(Uoff–Uon) > 30. These conditions qualitatively reflect a "weak" adjustment of the CP system and care has to be taken to fulfill the requirements of the relevant CP standard (Reference 2, for example). It should be noted that the "weak" adjustment of Uon will most probably provide insufficient protection against AC corrosion, but corrosion protection shall be achieved by reducing Uac.
Data suggest, however, that a careful adjustment of Uon is helpful for achieving low AC corrosion rates. This conclusion is supported by results from measurements using electric-resistance probes described in Reference 12.
Relatively low corrosion rate if Uac/(Uoff–Uon) < 1 which reflects conditions in which Uon nearly or fully compensates the positive (anodic) part of → This technique has been described elsewhere.13
Relatively high corrosion rate if 1References
1. Technical Recommendation No. 7 (May 1982) "Measures for the installation and operation of pipelines in the vicinity of three-phase high-voltage systems and single-line traction systems," Verlags-und Wirtschaftsgesellschaft der Elektrizitätswerke mbH–WVEW, Frankfurt Main, 1985.
2. DIN EN 12954; Kathodischer Korrosionsschutz von metallischen Anlagen in Böden und Wässern - Grundlagen und Anwendung für Rohrleitungen; Deutsche Fassung EN 12954:2001.
3. Baeckmann, W.V., Schwenk, W., Handbuch des kathodischen Korrosionsschutzes, Wiley VCH, 4. Auflage, 1999.
4. "Korrosionsschutz erdverlegter Rohrleitungen," Kompetenz-Center Korrosionsschutz ruhrgas AG (Hrsg.); Vulkan-Verlag Essen, 2002.
5. Bieler, J., Voute, C.-H., Büchler, M., and Stalder, F., Messmethode zur Feststellung der durch Wechselströme verursachten Korrosionsgefährdung an kathodisch geschützten Rohrleitungen; Schweizerische Gesellschaft für Korrosionsschutz, Zürich, 2001; Schlussbericht zum FOGA-Projekt 0055.
6. Funk, D., Schöneich, H.-G., 3R international, Vol. 41 (2002), Heft 10-11, S. 582-585; M. Melis, D. Funk, H. G. Schöneich, "The use of coupons in the field of AC corrosion of pipelines," CEOCOR, proceedings of the plenary meeting, Zurich, 2002.
7. CEOCOR; A.C. corrosion on cathodically protected pipelines, APCE, Italy, 2001.
8. Camitz, G., and Persson, C., "Ac corrosion of cathodically protected steel in soil/field investigation with low constant ac-voltage," CEOCOR, proceedings of the 6th International Colloquium, Giardini Naxos, Italy, 2003.
9. Gregoor, R., and Pourbaix, A., "Detection and assessment of ac-corrosion," CEOCOR, proceedings of the 5th International Colloquium, Brussels, 2000.
10. Stalder, F., and Schöneich, H.-G., "Characteristics of potential measurements in the field of ac-corrosion," CEOCOR, proceedings of the 6th International Colloquium, Giardini Naxos, Italy, 2003.
11. Leutner, B., Losacker, S., and Siegmund, G., 3R international, Vol. 37 (1998), p. 135.
12. Nielsen, L.V., and Cohn, P., "AC-corrosion in pipelines; field experiences from a highly corrosive test site using ER corrosivity probes," internal report for DONG, 2003.
13. Peez, G., gwf - Gas-Erdgas 134 (1993) Heft 10-11, S. 582-585; W. Prinz, H.-G. Schöneich; gwf—Gas/ Erdgas 134 (1993) Heft 12, S. 621-626.
The author
Hanns-Georg Schöneich has worked for 18 years at Ruhrgas AG, Essen, Germany, in the field of corrosion protection, coatings, high-voltage interference of pipelines. He holds a master's in physics and a PhD in physical chemistry from the University of Münster.
