Fixed-choke circulation vents riser gas
Venting riser gas during a gas influx event relieves riser pressure and enables pit monitoring, but it can lead to uncontrollable discharge. A novel fixed-choke, constant-outflow (FCCO) method fixes the choke opening throughout circulation and manages outflow and backpressure by only adjusting pump rate. The method compensates for low-capacity gas-handling mud-gas separators (MGS), choke manifolds, and flow lines by circulating gas out of the riser safely and effectively.
To investigate FCCO, researchers at Louisiana State University (LSU) performed gas circulation tests in a riser simulator with both water and synthetic based mud (SBM). Differential pressures across the riser tracked the gas bubble in real time from multiple gauges. This tracking method correlated well with experimental results. Comparison of the gauge-derived gas migration analysis with fiber optic distributed temperature sensing (DTS) and distributed acoustic sensing (DAS) data showed good correlations with gas arrival, gas column length, and gas rise velocity.
Riser gas circulation
Conventionally, riser gas is circulated out of the riser by maintaining constant applied surface backpressure (ASBP) or constant bottomhole pressure (CBHP). Circulating requires incrementally opening the choke as gas migrates to surface. These larger choke settings and increasing gas cuts can overwhelm the MGS. Alternatively, circulating at constant rate without enforcing a minimum applied backpressure may result in well-control issues. FCCO addresses these issues by manipulating rate to keep riser bottom-pressure constant by manipulating rate.
The Riser Gas Handling (RGH) Subcommittee of the International Association of Drilling Contractors (IADC) Underbalanced Operations & Managed Pressure Drilling committee produced guidelines based on the FCCO method. In conventional operations, the method controls significant gas-in-riser events by closing the riser at top (at the surface annular or rotating control device) and bottom (at the BOP) and circulating through the choke-kill lines. Constant CBHP requirements or casing shoe breakdown pressures are not limiting factors for circulation. Precise circulation rate adjustments, however, are required for gas influx management. A system that tracks gas bubbles in the riser would aid in pump control by anticipating the expected time of arrival of gas at the surface and at the MGS. To test gas-tracking systems, LSU conducted full-scale FCCO riser tests with gas migration monitored by pressure gauges and fiber optic instrumentation.
FCCO tests
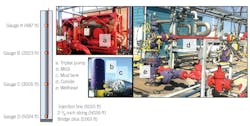
LSU simulated riser gas removal by the FCCO method in water and SBM columns in a full-scale riser converted from LSU Well 2 (Fig. 1). The riser annulus was between the 9 5/8-in. casing and 2 7/8-in. tubing. The tubing contained four downhole annular permanent pressure-temperature (PT) gauges with bidirectional telemetry at 487, 2,023, 3,502, and 5,024 ft. A dual DTS and DAS fiber optic cable ran from surface to bottom of the tubing.
Nitrogen gas was injected at the bottom of the annulus through a ½-in. chemical injection-line attached to the tubing. Pressure sensors measured surface annulus and tubing pressures. A surface automated adjustable choke with a 3-in. trim orifice controlled ASBP during circulation. A triplex pump circulated the well and an MGS separated gas from the outflow. Real-time data collection included downhole gauge pressure and temperature, pump strokes, circulation rate, tank level, liquid outflow, gas-well storage pressure, gas injection pressure, gas temperature, annulus pressure, tubing pressure, choke position, choke pressure, and chokeline fluid density. A total of 37 tests were conducted, 17 in water and 20 in SBM. These were the first FCCO tests performed in SBM. The paper only reported results from seven tests.
The fluid was initially circulated until homogenized and free of air or gas and then shut in until Gauge D pressure and temperature readings stabilized. For water-nitrogen tests, 5 bbl of nitrogen gas was injected at 0.34 bbl/min (bpm) with rate controlled through the injection line. Water density was 8.3 lb/gal (ppg). Water gain measured at the pit gain confirmed that the annulus received the planned volume of nitrogen.
For SBM-nitrogen tests, dissolution of nitrogen gas into the SBM required higher volumes of nitrogen and gas was bullheaded. After preliminary injection-line and bullheading tests, 15 bbl of nitrogen was spotted inside the tubing by bullheading at 4.7 bpm. SBM was olefin-based with 8.34 ppg density and 20-21 lb/100 sq ft yield point.
As the gas column inside the tubing stabilized, circulation started and ramped up to 200 gpm to create the influx for circulation tests. Once the total gas volume circulated to the bottom of the annulus, the pump rate was adjusted to the preplanned circulation rate. The choke was set to a fixed choke-opening percentage determined by the circulation rate and desired ASBP.
For both water and SBM tests, surface tubing pressure, bottom annulus pressure, and flow rate through the annulus were monitored during gas filling. Injection stopped after reaching the precalculated surface tubing pressure.
Test results
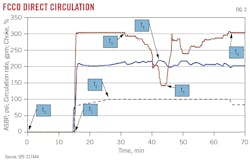
For water-nitrogen tests, the choke was 80% open at the start of circulation at 300 gpm (Fig 2, time t1). ASBP was kept initially at 200 psi and choke opening gradually increased to 100% at time t2. Once backpressure reached 215 psi, it was maintained at 200-215 psi by reducing circulation rate (beginning at time t3). Peak surface pressure occurred at t4 and required a quick circulation reduction to 150 gpm at t5. Once backpressure declined, rate increased back to 300 gpm by t6 with choke opening reduced back to 80%. All gas circulated out of the well in 55 min.
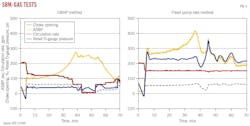
For SBM, four tests applied the FCCO method and two applied the CBHP and constant pump rate method for comparison. The CBHP test is shown in Fig. 3 (left). Once gas circulated to the bottom of the annulus, circulation rate was reduced to 125 gpm and the choke was held about 60% open. These conditions maintained a constant pressure of 2,230 psi, 40 psi above hydrostatic, at the bottom of the annulus. Once surface annulus pressure started increasing, circulation reduced at 26 min to maintain constant bottom-hole pressure as shown in the reset Gauge D data (reset gauge pressure refers to zeroing reference pressure at the start of the test and tracking only changes in pressure). Surface pressure continually increased due to upward migration and expansion of gas, and circulation stopped at about 42 min. Maximum ASBP reached about 275 psi. After bleeding off pressure, circulation restarted with pump rate adjustments to maintain 250 psi ASBP until the influx was out of the annulus. Bottom hole pressure was largely constant throughout the test.
A constant circulation-rate test established rate at 150 gpm, but surface pressure quickly rose from 250 psi to peak at more than 400 psi (Fig. 3, right). Surface pressure subsequently decreased as gas circulated out of the well, but bottom-hole pressure increased and fluctuated during this period.
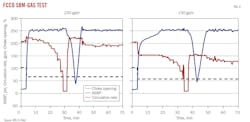
Fig. 4 shows results from FCCO tests with planned 250 psi ASBP and circulation at 220 gpm (left) and 150 gpm (right). Pump-rate adjustments during the tests maintained maximum allowed ASBP. Compared with the CBHP and constant circulation-rate tests, FCCO tests yielded lower and more controlled surface backpressure. The constant pump-rate method requires surface pressure reduction by opening the choke as the gas reaches the surface, resulting in high volumes of gas and gas-liquid mixture which can overload the MGS.
Gas tracking
The differential-pressure method tracks the movement and estimates gas front (F) and tail (T) velocities. A water-nitrogen FCCO test shows how changes in reset gauge-pressure differential reveal F and T velocities across each gauge (Fig. 5, bottom). The deepest pressure gauge (D) shows a drop in pressure as the gas front at gauge D enters the annulus, until all gas injection ended after 14.33 min of gas influx at which point the gas tail began. The plot shows the gas front arriving at Gauge C and subsequently moving upward, showing similar responses at Gauges B and A. Once gas is above a gauge, the gauge will continue to show gas effects for the remainder of gas movement above that gauge. This methodology can also be used for gas in SBM.
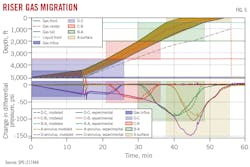
If more than one gauge is installed in the riser, and data are transmitted in real time, it is possible to use this data analysis to automate the FCCO process. A gas-front model estimates the gas-front position using a drift-flux correlation consisting of momentum and mass conservation equations. The upper graph in Fig. 5 shows the F and T moving up the annulus in a water-nitrogen experiment, and the lower graph shows the experimental and modeled differential gauge pressures. Modeling produced a good match with the experimental differential pressure-derived gas migration analysis. Both accurately show where the gas influx head and tail are.
Fiber data
DTS and DAS fiber optic sensors installed in the test annulus verified gas signatures and time of arrival to surface. High-resolution DTS data were subjected to Gaussian smoothing and gradient analysis to clarify gas signatures. DAS strain-rate data were processed using frequency band energy (FBE) analysis, denoising, and Gaussian smoothing for gas signature clarification. The 1,000–2,000 Hz frequency-band best captured acoustic events.
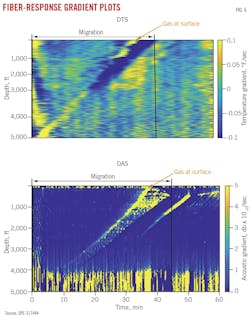
DAS data confirmed these estimates and proved that fiber data accurately monitors real-time gas signatures across the riser. Comparison of the gauge-derived gas migration with fiber optic DAS and DTS data showed good correlations with gas arrival at surface, pressure gauge-derived gas column lengths, and pressure gauge-derived gas rise velocity.
Bibliography
Gabaldon, O., Humphreys, G., Teixeira, M.L., Gonzalez-Luis, R.A., and Souza, P., “Is Handling Gas in the Riser a Safe Alternative? Exploring the Limits and Opportunities for Safer Kick Handling During Deepwater Drilling,” IADC/SPE-215879-MS, IADC-SPE Managed Pressure Drilling & Underbalanced Operations Conference & Exhibition, Denver, Colo., Oct. 3-4, 2023.
Kunju, M.R. and Almeida, M.A., “Analysis of Riser Gas Pressure from Full-Scale Gas-in-Riser Experiments with Instrumentation,” SPE-206389, IADC-SPE Managed Pressure Drilling & Underbalanced Operations Conference & Exhibition, Virtual, Sept. 14-16, 2022.
Wei, C., and Chen, Y., “A study of the fixed choke and constant outflow method for riser gas handling,” Process Safety and Environmental Protection, Vol. 174, June 2023, pp. 756-769.
Based on “Fixed Choke Constant Outflow Circulation Method for Riser Gas Handling: Full-Scale Tests in Water- and Synthetic-Based Mud with Gauges and Distributed Fiber-Optic Sensors,” SPE-217444, SPE Journal, Vol. 29, No. 1, Jan. 10, 2024.
About the Author

Alex Procyk
Upstream Editor
Alex Procyk is Upstream Editor at Oil & Gas Journal. He has also served as a principal technical professional at Halliburton and as a completion engineer at ConocoPhillips. He holds a BS in chemistry (1987) from Kent State University and a PhD in chemistry (1992) from Carnegie Mellon University. He is a member of the Society of Petroleum Engineers (SPE).