US DUC inventory stabilizes, depletion rates accelerate
Artem Abramov
Rystad Energy
Oslo, Norway
The number of drilled but uncompleted (DUC) oil wells stabilized in US unconventional plays during 2017.Meanwhile, some Eagle Ford wells showed higher initial production (IP)rates but faster decline rates.
Rig counts stayed relatively flat throughout the second half of the year while oil service companies continuously expanded the number of active hydraulic fracturing fleets.
Completions had nearly caught up with drilling by Dec. 31, 2017.
DUC inventory statistics reflect net changes in drilling and completion activities. More completions reduced the DUC inventory.
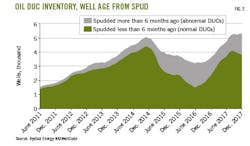
Fig. 1 shows 5,393 DUC horizontal oil wells as of Dec. 17, 2017, for all US unconventional plays. Many of these DUCs are scheduled for completion in early 2018.
Fig. 2 shows the ages of wells since spudding. A shift toward large pads with longer laterals is causing a lag of 7-9 months from spud to completion. Industry previously considered a 6-month lag as typical although the time threshold between drilling and completion varies greatly by play and by operator.
Abnormal DUCs (the result of intentional completion delays) declined 40% between June 2016 and April 2017, Rystad NASWellCube statistics showed. Constrained service capacity limited the recovery in completions during second-half 2017.
Moving into 2018, DUC inventory will play a paramount role for new supply additions from US shale. Natural cycle time, (spud to completion) in shale typically ranges 4 to 8 months.
Existing DUC inventory will account for most completions in coming months and new production volumes.
Modern high-density completion techniques can be applied to most DUCs, but well productivity is uncertain even in well-developed and proven areas. Shale wells in 2017 produced more oil and gas in the first few months than did wells drilled in 2010, which industry attributes to improved drilling techniques such as longer laterals along with higher volumes of proppant and fracturing fluids.
But IP rates do not necessarily translate into higher ultimate recovery rates. Rystad analysts observed strong empirical evidence in the Eagle Ford that showed steadily higher IPs but steeper and steeper decline rates. The examples raise questions about long-term durability of shale output.
Eagle Ford production
The Eagle Ford is a mature play where the total number of horizontal wells drilled and completed collapsed in 2015 compared with 2014.
With the shift toward more intensive completions, infill drilling, and down spacing on older pads, several major Eagle Ford operators reported faster reservoir depletion rates in 2017 compared with the decline rates observed 7 years ago.
Fig. 3 shows Eagle Ford horizontal oil wells drilled by quarter and by well type. The first horizontal well in each section is classified as a parent well. If a pad had two or more simultaneous first completions, both are classified as parent wells. All subsequent completions are classified as infill wells.
Up to 90% of activity involved new pad development during 2010, but new pad development fell to 15-20% during 2015-17. Infill development drove most 2017 horizontal drilling oil well completion activity in shale plays.
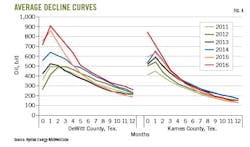
The South Texas counties of Karnes and DeWitt accounted for 30-36% of total completion activity for the Eagle Ford during 2015-17. Karnes County completions in 2017 returned to the peak levels seen in 2014, most via infill drilling. In DeWitt County, the IP for a new well completed in 2011 peaked at about 500 b/d compared with 900 b/d peak production for a well completed by 2016. Such gains indicate greater efficiency and climbing production.
But these production gains by well are less impressive when analysts considered the first full year of production compared with just 1-2 months.
Fig. 4 shows the evolution of average first-year decline curves during 2011-16, showing only wells that produced for at least 13 months. Average production rates in the peak production month (typically month 0 or 1) increased continuously over time in both counties. In DeWitt County, the peak production rate increased by 80-90% during 2015-16 compared with 2011-13. In Karnes County, the peak rate more than doubled in 2016 from 2011.
But Month 12 average production rate lagged the performance of recent completions. Although shale wells are known for fast depletion rates, Rystad notes that decline rates have become even steeper over time in plays like the Eagle Ford.
Oil companies and others typically review initial production rates from new wells very early. It is tempting to assume that decline rates will be the same as for old wells and to model estimated ultimate recovery based on that assumption.
In fact, it is often not the case. Some recent EURs might be somewhat exaggerated.
In DeWitt County, wells from all vintages typically produce 190-260 b/d in the 12 months after they come on stream, with Month 12 wells showing the lowest average production rates during 2015.
Karnes County 2015-16 completions also underperformed previously completed wells.
A typical 2016 completion delivered 40,000 bbl more oil during the first year of production than a 2011 completion. But the well completed in 2016 entered the second production year with a similar production rate to the well completed in 2011. This cannot be classified as a significant uplift in ultimate recovery despite the initial 100% increase in peak production.
It is important to look at individual leases to accurately examine well productivity. This approach can reveal an even more drastic difference in well productivity between parent and infill wells.
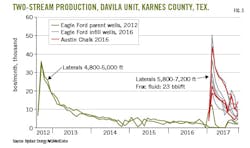
Rystad evaluated a specific lease, Marathon Oil's Davila unit in Karnes County. Two parent wells were completed in 2012 with lateral lengths around 4,900 ft and fracturing fluid loadings of 11 bbl/ft. Production peaked at an average 35,600 boe/month in August 2012 on a two-stream basis. But in 13 months, the average production rate fell below 8,000 boe/month.
Over 5 years, these wells produced 350,000 boe and 420,000 boe, respectively.
During late 2016, Marathon completed eight infill Eagle Ford wells and three infill Austin Chalk wells These completions were intensive compared with the parent wells. The infill wells had 5,800-7,200 ft laterals and an average fracturing fluid loading of 23 bbl/ft. Nevertheless, only four of these completions outperformed the parent wells in peak production and the average peak rate was 32,500 boe for Eagle Ford wells and 28,900 boe for Austin Chalk wells.
Average production rate fell below 8,000 boe per month just 7 months after the peak month, indicating faster reservoir depletion than for the parent wells. After 10 months on production, cumulative recovery averaged 150,000 boe, 17% less than the parent wells.
Marathon executed another completion round in the Davila unit in August 2017 with even more intensive completions. Four new Eagle Ford wells and one Austin Chalk completion were scheduled to come on stream during third-quarter 2017. Production results from these infill completions had yet to be reported in Texas state filings as of December 2017.


