Elastic wave velocities identify igneous gas, water layers in Junggar basin

Jun Jia
Liqiang Sima
Liang Wang
Southwest Petroleum University
Chengdu, China
Hui Zhao
Chuanqing Drilling Engineering Co. Ltd.
Chengdu, China
Crossplots of elastic wave velocity and resistivity can identify gas and water zones in tested formations of northwest China's Junggar basin. The Junggar basin features low-porosity igneous formations, which can make fluid types difficult to identify, longitudinal (Vp) and transversal wave velocities (Vs) being weakened in gas and water zones. Complex lithologies and greater silica (SiO2) content in igneous rocks further limit fluid-type identification.
For intermediate-basic rock and acid rock, Vp/Vs ratios are 1.83 and 1.75, respectively, which effectively distinguishes gas and water zones. But low porosity makes distinguishing between gas zones and gas-water coexistence zones difficult. Elastic wave velocity measured via the ultrasonic pulse method can reveal the physical mechanisms identifying gas and water zones in igneous rock. This article also links the physical mechanism to the internal factors of these reservoirs, further identifying fluid types.
The study described in this article obtained Vp and Vs of igneous cores from Junggar basin in dry and water-saturated states to determine other internal influences on elastic wave velocity such as lithology, porosity, and density. Analysis shows that gas-bearing formations will decrease both Vp and Vp/Vs ratio but with only a small impact on Vs, which provides the physical basis for identifying of gas and water zones by elastic wave velocity.
Vp/Vs ratio has a nonlinear positive correlation with porosity. In formations with low porosity, its ratio in gas and water zones changes slightly. Therefore, porosity's influence should be considered in identifying reservoir fluid types based on Vp/Vs ratio, especially in low-porosity formations. The relationship between elastic wave velocity and density, known as the Gardner function, is an empirical formula that requires regression-formula fit for other local areas to obtain optimal parameters.
Experiment history
Well logging generally uses electronic and non-electronic methods. The most common non-electronic method relies on acoustic and physical properties of rocks to analyze differences in gas zones and water zones determined by the formation's elastic wave velocity and velocity ratio.
Early studies observed response characteristics of elastic wave velocity to different fluids. Focus eventually shifted to in-depth analyses of influencing factors and physical mechanisms related to elastic wave velocity.
External factors including temperature and pressure influence elastic wave velocity. But the research for this article focuses on internal factors such as petrology, physical rock properties, and fluid saturation.1-9
Elastic wave velocities differ in stone with varying mineral compositions and contents. Research has established laws of Vp and Vs in different rock types and studies have proposed a linear relationship between the compression or P-wave velocity and formation porosity. 3 10-23
Past research primarily focused on clastic and carbonate rocks. For igneous rock, which is compacted with a complex lithology, the influence of internal factors on elastic wave velocity and the carboniferous cores from the Junggar basin needed further study. The experiment measured elastic wave velocities in igneous cores with the ultrasonic pulse method and analyzed the rocks' influencing internal factors, revealing the physical mechanisms affecting elastic wave velocity. In addition, lab work applied well testing data to calibrate existing logs. Fluid-type identification in igneous rock reservoirs was guided by existing research on identifying gas and water zones using Vp and Vs.
Method, apparatus
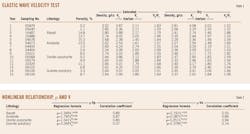
The experiment analyzed 15 intermediate-basic and acid igneous rock samples collected from a Carboniferous formation at a depth of 3,600 m in the Junggar basin (Table 1, Fig. 1). X-ray diffraction and thin-section authentication determined the rocks' mineral compositions. Technicians processed the samples into 50-mm long cylinders with a diameter of 25 mm and baked them at 50° C. for 48 hr. The dried samples were maintained in a vacuum state.
Researchers induced water-saturation by submerging the rock samples under atmospheric conditions for 48 hr. Plastic film wrapped on the side surface of the samples prevented moisture loss.24 25

The GCTS-RTR-1000 rock mechanics system tested each sample. Technicians replaced the system's standard hydraulic pressure head with a bearing-type acoustic wave transducer to apply axial pressure to samples with a maximum loading capacity of up to 960 khz. The transversal-wave excitation center frequency measured 620 khz with an accuracy of 0.1 μs. The experiments used longitudinal and transversal waves with a RIGOL-DS5022M oscilloscope connected to a computer for synchronous acquisition of time differences (Fig. 2). Length-measurement error and data acquisition time resolution were 0.1 mm and 0.02 μs, respectively.

The transducer converted the pulse transmitter's high-voltage signal into ultrasonic waves, which were then applied to each rock sample. The oscilloscope measured the difference (T) between ultrasonic pulse generation and reception times. The ultrasonic waves' transmission times (Tt) in the rock samples were calculated by deducting the transmission time (T0) in the coupling layer. The wave velocity (V) is calculated by dividing Tt by rock sample length (L), (V = (T-T0)/L).
Analysis
Under an axial pressure of 5 MPa and at normal temperature, Vp in the water-saturated rock core was higher than that in the dry rock sample. The average Vp ratio before and after water saturation was 1.17. The Vp ratio for basalt was 1.32, which is higher than average. Andesite's was closer to the average. Diorite porphyrite and granite porphyry both had Vp ratios of 1.09. Water saturation had a minor influence on Vs in the rock samples. Vs ratios before and after water saturation were 1.05 (Table 1).
Velocity-fluid relationship
Vp is sensitive to gas content in igneous rock and Vp values for dry samples (gas-saturated) are lower than those of water-saturated samples (Fig. 3). A small amount of gas can lead to a significant decrease in Vp values. Vs is not sensitive to gas and Vs values from rock samples before and after water saturation underwent little change. Vs increases slightly with higher gas saturation. During the experiment, some rock samples displayed higher Vs when saturated with water than in the dry sample, an effect of the relatively low experimental pressure.25

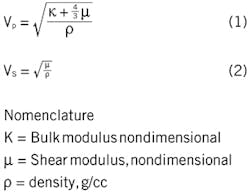
The transmission mechanism through the media and gas and water's physical properties result in the difference between Vp and Vs. The transversal wave transmits as a sine wave that causes no change to medium or pore volume. In addition, water is not resistant to shearing and, according to the theoretical formula for elastic wave velocity, the transversal wave is not affected by water saturation and its velocity is always close to its wave velocity in dry rocks. The longitudinal wave, which transmits as a compression wave, changes the shape and volume of medium pores and is affected by pore water saturation. When pores are saturated with water, the longitudinal wave can be transmitted in a coupling manner through water and rock particles, shortening the transmission path and making the wave velocity much higher than that in dry rock samples (see Equation box).
Velocity-porosity relationship
Elastic wave transmission velocity in pore fluids is much lower than in rock. The elastic wave velocity decreases as porosity increases both in dry and water-saturated samples. Water shear modulus (μ) is zero and rock-sample density increases with higher porosity because the rock is saturated with water. Vs decreases according to the theoretical formula for elastic wave velocity.
The bulk modulus (K) of rock samples increases slightly when changing from a dry to a water-saturated state, counteracting any effect caused by increases in water-saturated sample density and reducing the descending trend of Vp while increasing the Vp/Vs ratio. The Vp and Vs characteristics of test samples in both water-saturated and gas-saturated states agree with the theoretical criteria (Fig.3).
Based on previous studies on the Vp/Vs ratio, wave velocities increase exponentially with higher porosity.11 13 20 26 When rock porosity is low, this ratio increases at a slower pace. When rock porosity is greater than 40%, this ratio increases more rapidly (Fig.4).

Velocity-density relationship
The elastic wave velocity in rock increases with density and a still higher increase is observed in Vp. To eliminate porosity and water's interference, this study researched dry core samples. The Gardner function (ρ = cVpa) fit the relationship between elastic wave velocity and density of rock samples with different lithology. Vp has a power function relationship with density and, except for granite porphyry, there is a strong correlation in the lithology of other rocks (Table 2). Vs also has a power function relationship with density, except for a decrease observed in diorite porphyrite.
Velocity-lithology relationship
Minerals are bonded together in igneous rock with limited pore space, giving the rock's mineral composition a greater influence on elastic wave velocity. The relationship between core sample density and Vp shows velocity transmission in basic rock as having the highest increase, followed by intermediate rock, and then acid rock (Fig. 5). Compared with igneous rock, the longitudinal wave is transmitted slowly in SiO2, and SiO2 content decreases with lithology transition from basic rock to acid rock. Therefore, the transmission velocity of elastic longitudinal waves in basic rock with low SiO2 content is higher than in acid rock with high SiO2 content, which concurs with previous research on the relationship between Vp and SiO2 content in igneous rock.27

Practical application
The Vp/Vs ratio decreases in gas-bearing formations and increases relative to higher porosity. Lithology and density also influence this ratio. Applied to Carboniferous igneous rock reservoirs, the crossplot between Vp/Vs and resistivity (Rt) identifies gas and water zones with Rt best reflecting the different characteristics of different fluids. Discrimination charts established for various lithologies can eliminate these characeristics' influence.
The Vp/Vs-Rt crossplot of intermediate-basic rock shows that when Vp/Vs value is equal to 1.83, gas and water zones can be clearly distinguished (Fig. 6a). With the exception of some individual test points, the Vp/Vs value of gas-bearing zones is below 1.83, lower than that of water zones.

The low degree of porosity development weakens the difference between gas and water zones in igneous rock. The gas-water coexistence zone cannot be distinguished effectively and may be classified as water zone intervals by mistake. The Vp/Vs-Rt crossplot of acid rock is similar to that of the intermediate-basic rock (Fig. 6b). But lithology's influence decreases wave velocity and reduces the Vp/Vs ratio distinguishing between gas and water zones to 1.75.
References
1. Faust, L.Y., "A velocity function including lithologic variation," Geophysics, Vol. 18, No. 2, April 1953, pp. 271-287.
2. Birch, F., "The velocity of compressional waves in rocks to 10 kb, Part I and II," Journal of Geophysical Research, Vol. 66, No. 7, July 1961, pp. 1083-1102 and pp. 2199-2224.
3. Birch, F., "Compressibility; Elastic Constants," in "Handbook of Physical Constants," Geological Society of America Memoirs No. 97, 1966, pp. 97-174.
4. Shen, L.D., Shi, G., "Effect of lithologic character, petroleum and effective overburden pressure on compressional wave and shear wave velocity," Acta Geophysica Sinica, Vol. 37, No. 3, January 1994, pp. 391-399.
5. Meglis, I.L., Greenfield, R.J., Engelder, T., and Graham, E.K., "Pressure dependence of velocity and attenuation and its relationship to crack closure in crystalline rocks," Journal of Geophysical Research Atmospheres, Vol. 101, No. B8, Aug. 10, 1996, pp. 17523-17533.
6. Timur, A., "Temperature dependence of compressional and shear wave velocities in rocks," Geophysics, Vol. 42, No. 5, August 1977, pp. 950-956.
7. Kern, H., "The effect of high temperature and high confining pressure on compressional wave velocities in quartz-bearing and quartz-free igneous and metamorphic rocks," Tectonophysics: High-Pressure Science and Technology, Vol. 44, No. 1-4, Jan. 10, 1978, pp. 185-203.
8. Kern, H. and Richter, A. "Temperature derivatives of compressional and shear wave velocities in crustal and mantle rocks at 6-kbar confining pressure," Journal of Geophysics, Vol. 49, 1981, pp. 47-56.
9. Christensen, N.I., "Compressional wave velocities in rocks at high temperatures and pressures, critical thermal gradients, and crustal low-velocity zones," Journal of Geophysical Research, Vol. 84, No. B12, Nov. 10, 1979, pp. 6849-6857.
10. Pickett, G.R., "Acoustic character logs and their application in formation evaluation," Journal of Petroleum Technology, Vol. 15, No. 6, June 1963, pp. 429-434.
11. Castagna, J.P., Batzle, M.L., and Eastwood, R. L., "Relationships between compressional-wave and shear-wave velocities in clastic silicate rocks," Geophysics, Vol. 50, No. 4, April 1985, pp. 571-581.
12. Li, Q., "Velocity regularities of P- and S-waves in formations," Oil Geophysical Prospecting, Vol. 27, No. 1, Jan. 1, 1992, pp. 1-12.
13. Domenico, S.N., "Rock lithology and porosity determination from shear and compressional wave velocity," Geophysics, Vol. 49, No. 8, August 1984, pp. 1188-1195.
14. Wilkens, R., Simmons, G., and Caruso, L., "The ratio Vp/Vs as a discriminant of composition for siliceous limestones," Geophysics, Vol. 49, No. 11, November 1983, pp. 1850-1860.
15. Wilkens, R.H., "Physical properties of rocks: fundamentals and principles of Petrophysics," Eos Transactions American Geophysical Union, Vol. 78, No. 51, 2015.
16. Wyllie, M.R.J., Gregory, A.R., and Gardner, L.W., "Elastic wave velocities in heterogeneous and porous media," Geophysics, Vol. 21, No. 1, January 1956, pp. 41-70.
17. Wyllie, M.R.J., Gregory, A.R., and Gardner, G.H.F., "An experimental investigation of factors affecting elastic wave velocities in porous media," Geophysics, Vol. 23, No. 3, July 1958, pp. 459-493.
18. Raymer, L.L., Hunt, E.R., and Gardner, J.S., "An improved sonic transit time-to-porosity transform," Society of Petrophysicists and Well-Log Analysts (SPWLA) 21st Annual Logging Symposium, July 8-11, 1980, Lafayette, La.
19. Han, D. and Nur, A., and Morgan, D., "Effect of porosity and clay content on wave velocity in sandstones," Geophysics, Vol. 51, No. 11, November 1986, pp. 2093-2107.
20. Tosaya, C. and Nur, A., "Effect of diagenesis and clays on compressional velocities in rocks," Geophysical Research Letters, Vol. 9, No. 1, January 1982, pp. 5-8.
21. Liu, B., Kern, H., and Popp, T., "Velocities and attenuation of p- and s-waves in dry and wet rocks with different porosities under different confining pressures," Acta Geophysica Sinica, Vol. 41, No. 4, 1998, pp. 538-544.
22. Shi, G. and Yang, D.Q., "The regression analysis study on velocity and porosity, and clay content of rocks," Acta Scientarium Naturaliam Universitatis Pekinensis, Vol. 37, No. 3, May 2001, pp. 379-384.
23. Biot, M.A., "Theory of deformation of a porous viscoelastic anisotropic solid," Journal of Applied Physics, Vol. 27, No. 5, May 1956, pp. 459-467.
25. Zhou, Z., Zhu, H., and Chen, W., "Experimental study on acoustic wave propagation character of water saturated rock samples," Chinese Journal of Rock Mechanics and Engineering, Vol. 25, No. 5, May 2006, pp. 911-917.
24. Zhu, H.H., Zhou, Z.G., and Deng, T., "Acoustic parameters of low-porosity rock under dry and saturated conditions," Chinese Journal of Rock Mechanics and Engineering, Vol. 24, No. 5, May 2005, pp. 823-828.
25. Miller, S.L.M., "Well Log Analysis of Vp and Vs in carbonates," Consurtium for Research in Elastic Wave Exploration Seismology (CREWES) Research Report, Vol. 4, 1992, pp. 1-12.
26. Zang, J., Lang, J., and Standifird, W., "Stress, porosity, and failure-dependent compressional and shear velocity ratio and its application to wellbore stability," Journal of Petroleum Science and Engineering, Vol. 69, No. 4, Sept. 1, 2009, pp. 193-202.
27. Schon, J.H., "Physical properties of rocks: Fundamentals and principles of petrophysics," Pergamon Press, Oxford, UK, 1996.
The authors
Jun Jia ([email protected]) is a PhD candidate in geodetection and information technology at Southwest Petroleum University, Chengdu, China. He holds an MS in petroleum engineering from Southwest Petroleum University. He previously was a research assistant with the North China oil and gas branch of China Petroleum & Chemical Corp. (Sinopec).
Liqiang Sima ([email protected]) is a professor at Southwest Petroleum University. He holds PhD in geological resources and geological engineering from Southwest Petroleum University (July 2005). He worked previously for China National Petroleum Corp.'s (CNPC) logging company, Chuanqing Drilling Engineering Co. Ltd., Chengdu.
Liang Wang ([email protected]) is a lecturer in Southwest Petroleum University's School of Geoscience & Technology. He holds a PhD in geological resources and geological engineering from China University of Petroleum, Beijng (July 2015).
Hui Zhao ([email protected]) is a senior engineer at Chuanquing Drilling Engineering Co. Ltd.. He holds a PhD in geodetection and information technology from Southwest Petroleum University (July 2010).