Shear-wave data enhance reservoir characterization
Bob A. Hardage
Bureau of Economic Geology
University of Texas
Austin
A new approach to shear-wave data acquisition should lead to expanded use of shear waves in prospect evaluation and reservoir characterization. This technology not only allows shear-wave seismic data to be acquired at low cost, but it also expands the range of earth surface conditions over which shear-wave sources can be deployed.
Deep geology is illuminated by two types of seismic waves–a compressional (P) wave and a shear (S) wave. Most seismic programs record only P waves. S waves have great value, however, for detecting and estimating rock properties needed for reservoir characterization.
In particular, S waves react to azimuthal anisotropy properties of rocks much more robustly than do P waves. When an S wave propagates through an interval that has embedded azimuthal anisotropy, it splits into two daughter waves called the fast-S mode and the slow-S mode.
A P wave can also exhibit fast and slow behavior but does so more weakly than an S wave. Because of this wave physics, S waves are far more valuable than P waves for detecting and characterizing fractures, subtle faults, and stress fields, all of which induce azimuthal anisotropy in layered rock and are key pieces of geologic information needed to exploit unconventional reservoirs.
When both P and S data are available, the velocity ratio VP /VS (VP = P-wave velocity; VS = S-wave velocity) can also be determined across targeted stratigraphic intervals. This velocity ratio is one of the best seismic attributes for distinguishing variations in rock type and is invaluable for mapping lithological variations within reservoir systems. Much more could be said about the value of S waves in geologic interpretations of reservoirs, but this article focuses on key applications that S waves provide.
Shear-wave acquisition
Even though S waves contribute valuable information for prospect development, the amount of S-wave seismic data that is recorded worldwide is small compared with the amount of P-wave data that are acquired across prospective basins. There are reasons, both on the acquisition and processing side of S-wave technology, that account for the low use of S-wave reflection seismology.
Downgoing S wavefields are produced directly at a source station by simple vertical-force sources (e.g., vertical vibrators, vertical impacts, shot hole explosives), which are widely distributed around the globe and considered by most geophysicists to be only P-wave sources. Vertical-force sources, however, produce robust SV (vertical shear) displacements in addition to P displacements at the point where they apply their force vector to the surface.
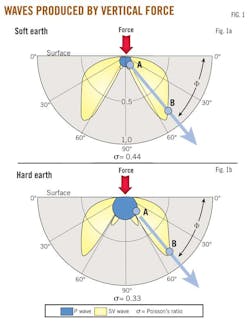
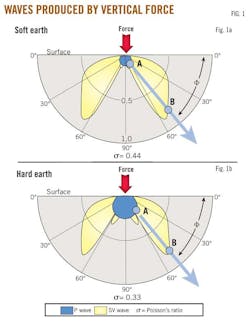
This direct-S illumination of geology by vertical-force sources has simply been ignored for decades. Fig. 1 illustrates the geometrical shapes and relative amplitudes of direct-P and direct-S modes produced by a vertical-force source. The SV radiation patterns are designated direct-S modes to distinguish them from SV wavefields created by P-to-SV mode conversions at interfaces remote from a source station.
At takeoff angle ϕ, the amplitude of the direct-P mode is A and the amplitude of the direct-SV mode is B. For a wide range of surface stiffness, a vertical-force source produces more SV-wave energy than P-wave energy.
Wave patterns
Researchers with the University of Texas at Austin's Exploration Geophysics Laboratory performed extensive field experiments to determine the P and S radiation patterns and wave-mode strengths of P and S modes produced by all generic types of vertical-force sources–vertical vibrators, vertical impacts, and shot hole explosives. In all tests, the amplitude strength of the direct-S mode produced by a vertical-force source was larger than the amplitude strength of the direct-P mode, often by a factor of five or greater.
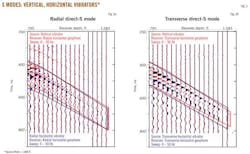
The direct-S radiation pattern produced by a vertical-force source was compared with the direct-S radiation pattern produced by a horizontal vibrator, considered to be the "gold standard" for an S-wave seismic source. We find the direct-S wavefields produced by a vertical-force source are identical to the direct-S wavefields produced by a horizontal vibrator. Fig. 2 shows one such comparison of S wavefields produced by vertical and horizontal vibrators.
Fig. 2a displays the radial-S geophone response to a direct-S wavefield produced by a vertical vibrator (red traces) overlain by the response to the direct-S wavefield produced by a radial horizontal vibrator (blue traces). Fig. 2b represents transverse-S geophone response to a direct-S wavefield produced by a vertical vibrator (red traces) overlain by the response to the direct-S wavefield produced by a transverse horizontal vibrator (blue traces).
Vibrator positioning was identical for each test. Downhole receiver arrays maintained orientation during data recording. Both receivers and couplings remained unaltered.
Two types of direct-S data are produced by vertical-force sources. Type-1 direct-S data are S-S data, which involve a downgoing illumination S wave and an upgoing reflected S wave. Type-2 data are SV-P data, which involve a downgoing SV wave and an upgoing P wave. An SV-P mode provides the same S-wave information and S-wave attributes as does the P-SV mode that is used by numerous seismologists to evaluate hydrocarbon reservoirs when data are recorded with three-component (3C) geophones.
Direct-S data types
S-wave data acquisition with vertical-force sources provides two advantages. First, the cost of data acquisition is lower when P and S data are acquired with simple and reliable vertical-force sources such as vertical vibrators, vertical impacts, or shot hole explosives. It is no longer necessary to deploy three sources–a vertical-force source to generate direct-P data and two orthogonal horizontal-force sources to generate direct-S data. This step alone reduces the cost of S-S data acquisition by a factor of three because the number of deployed sources is reduced from three to only one.
Second, S-wave seismic programs can be implemented across any area where P-wave seismic programs can be done. Specifically, vertical-force sources allow S-wave data to be acquired in swamps, marshes, desert dunes, dense timber, and rugged mountain terrains. These are surface conditions under which the use of horizontal vibrators would not be considered.
For S-S data acquisition, the source side is simplified by use of a vertical-force source, while the receiver side remains unchanged. It will still be necessary to deploy 3C sensors to acquire S-S data when vertical-force sources are used just as it is when horizontal-force sources are used.
Even the receiver requirement can be simplified in situations in which the only direct-S mode that is needed is SV-P data because SV-P modes are recorded by vertical geophones. When adequate S-wave information can be provided by SV-P data, data acquisition uses exactly the same equipment that is used to acquire P-wave data–a vertical-force source and vertical geophones.
VSP applications
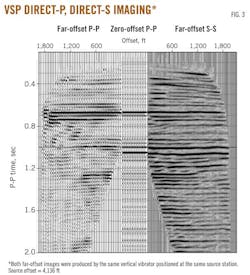
Vertical-force sources allow valuable direct-S images to be created from vertical seismic profile (VSP) data. Fig. 3 provides an example of S-S imaging at a Marcellus shale prospect. A vertical vibrator was positioned at a source station offset 4,136 ft (1,261 m) from a receiver well and simultaneously generated downgoing direct-P and downgoing direct-S modes. The P-P image (left column) made from the downgoing direct-P mode is displayed.
A second vertical vibrator generated zero-offset VSP data while positioned only 252 ft from the receiver. The P-P image (middle column) generated from these zero-offset data is shown.
The far-offset data recorded by the transverse geophones in the vertical receiver array provided enough information to construct an S-S image. This S-S image (right column) is displayed after the S-S image-time scale is compressed to agree with the P-P image-time scale. The agreement between the P-P and S-S images is good.
An impressive aspect of the transverse-S image is the robust nature of the S-S reflections associated with the geology in the time window between 0.9 and 1.1 sec. The bolder reflections in this data window are from top to bottom, respectively, the tops of the Upper Marcellus, Lower Marcellus, and Onondaga, the major targets of interest at this study site.
The downlapping events immediately below 1.2 sec in the S-S image (right column) show features of the Salina salt interval that are not revealed by the companion P-P image (left column). Fig. 3 represents the first public examples of a comparison of VSP images made from direct-P and direct-S modes generated simultaneously by the same vertical vibrator. Up to this time, such vertical-force source direct-S images have been shown only to sponsors of the Exploration Geophysics Laboratory at the Bureau of Economic Geology.
Surface-based seismic data
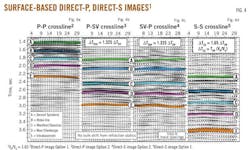
Seismic data acquired across the Wolfberry play in the Midland basin illustrate how vertical-force sources can be used to acquire direct-S data with surface-based receivers. An array of three inline vertical vibrators generated these test data recorded by single 3C geophones deployed at surface-based receiver stations. Fig. 4 compares four images constructed from the data. Two images were made from the direct-P mode, these being the P-P and P-SV images in Figs. 4a and 4b, respectively.
Common practice is to do no more than create only these two images with 3C-3D data generated by a vertical-force source. When attention is focused on the direct-S modes emanating from the vertical-vibrator source stations, two more images can be made, the SV-P and S-S images shown as Figs. 4c and 4d. These data are the first public exhibit of the four possible images that can be constructed from surface-based 3C data generated by a vertical-force source.
The data windows used in these image comparisons span deep geology that starts near the base of the Wolfberry interval and extends into nonproductive basement beneath the Ellenburger (depth of deepest marked reflection is more than 15,000 ft). Key formations in the P-P image were identified with a local synthetic seismogram (Fig. 4a). With the equation ∆TPSV = ∆TSVP = 0.5 ∆TPP (1 + VP /VS), these P-P reflection events can be transferred to their proper positions in the three companion image spaces (P-SV, SV-P, S-S).
These equations specify how depth intervals in P-P image space relate to equivalent depth intervals in P-SV, SV-P, and S-S image spaces. The VP /VS velocity ratio (1.65) involved in these data-space transitions is an average of VP /VS velocity ratios observed in three local wells. The identification of formation tops in each image is not precise but is sufficiently accurate to justify image comparisons of depth-equivalent geology.
The data examples in Fig. 4 emphasize the following points:
• The quality of direct-S images (Figs. 4c and 4d) is equivalent to the quality of direct-P images (Figs. 4a and 4b).
• Direct-S modes image geology at deep depths equivalent to the depths of direct-P imaging. For example, intrabasement event E labeled in Fig. 4 is at a depth of more than 15,000 ft.
• The resolution of direct-S images is equivalent to the resolution of direct-P images.
• Direct-S modes produced by a vertical-force source are just as valuable for imaging geology as are direct-P modes produced by the same source.
• The SV-P mode (Fig. 4c) provides the option of extracting valuable S-wave information and images from legacy P-wave data generated by a vertical-force source and recorded with only single-component vertical geophones.
The industry has used 3C geophones to acquire VSP data for decades. Thus the option for creating S-S and SV-P images from VSP data acquired with vertical-force sources is now available to users of VSP data.
The possibility of reprocessing legacy VSP data to create S-S and SV-P images should be particularly attractive. Such legacy VSP data can provide valuable S-wave information without any investment in new VSP data acquisition.
Up to this point, when explorationists have worked with 3C seismic data acquired with vertical-force sources, imaging options have been confined to only P-P and P-SV data (Figs. 4a and 4b). Direct-S modes produced by vertical-force sources however allow imaging options for 3C data to be expanded to include S-S and SV-P images (Figs. 4c and 4d).
Enhanced interpretation
Geologic interpretations will be more robust if these two direct-S images are included in the list of data that interpreters examine to analyze rock and fluid properties across prospects. In particular, the availability of S-S data can be important. Because S-S data are processed with common-midpoint (CMP) concepts, there will be some data-acquisition geometries for which S-S images may be more reliable than P-SV data processed with common-conversion-point (CCP) concepts.
Even when there is no justification for questioning P-SV data processing, it is wise to have a second S-wave image to integrate into an interpretation effort. The S-S images provided by vertical-force sources allow such a backup strategy.
Vertical-force land sources (vertical vibrators, shot hole explosives, and vertical impacts) produce direct-SV modes as well as direct-P modes. Thus the seismic sources needed to generate SV-P data are common P-wave sources that are widely spread around the globe.
Because the upgoing raypath of an SV-P mode is a P wave, SV-P data are recorded by vertical geophones. In contrast, P-SV data must be recorded by horizontal geophones, which requires 3C geophones. There can be cost savings in the data acquisition of a seismic program when data are acquired with vertical geophones rather than with 3C geophones. Also, many field-oriented geophysicists observe that vertical-geophone data are superior to horizontal-geophone data because vertical geophones usually couple to the earth better than horizontal geophones.
Because SV-P modes reside in data generated by common P-wave sources and are recorded by single-component vertical geophones, there is untapped SV-P data in legacy P-wave seismic data (both surface-based data and VSP data) preserved in seismic-data libraries in many countries. Thus for many prospect areas, interpreters could produce valuable S-wave images from legacy P-wave data without acquiring new seismic data.
Acknowledgments
Chesapeake Energy provided access to valuable VSP data, and Halliburton provided VSP data-processing support. Fasken Oil and Ranch Ltd provided the data shown in Fig. 4, and Fairfield Nodal processed the data. The author and the University of Texas at Austin are part owners of VertiShear, a company that licenses technology based on the vertical-force-source concepts discussed here.
The author
Bob A. Hardage ([email protected]) is senior research scientist at the Bureau of Economic Geology at the University of Texas, Austin. He has also served in management positions at Phillips Petroleum and WesternAtlas. He holds a PhD in physics from Oklahoma State University, Stillwater, Okla. He is a member of the Society of Exploration Geophysicists and the American Association of Petroleum Geologists.
