Geomicrobial survey results follow drilling success
Jeff Munnecke
Environmental
BioTecnologies Inc.
Lodi, Calif.
The Oriente basin of Ecuador is one of the most productive of the South American Sub-Andean basins. Cumulative production of oil at the end of 2011 was close to 3 billion bbl, and current production stands at 530,000 b/d.
The Oriente basin contains a sedimentary fill of Paleozoic to recent age. Major commercial interest is confined to the Cretaceous depositional cycle and all of the major production comes from fluvio-deltaic and marine sandstones of the Hollin and Napo formations.
Most of the productive structures are low-relief, north-south oriented anticlines of two distinct types: foot wall anticlines associated with normal faults (Type I) or hanging wall anticlines associated with reverse faults (Type II).
The origin of the oil is problematic because the potential source rocks, the marine claystones and limestones of the Cretaceous Napo formation, are generally immature or marginally mature within the confines of the present day Oriente basin.
There is a considerable variation of oil type found in these basins, from 37° API paraffinic oil with a GOR of 250-300 to altered 8° API oils. Marked variations exist not only among oilfields but also among reservoirs in the same well.
A look back
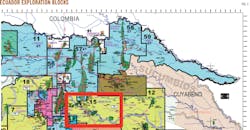
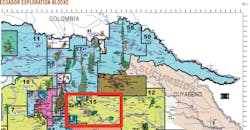
In 1999, Environmental BioTechnologies Inc. (EBT) conducted a geomicrobial survey of Ecuador's Block 15 for Occidental Petroleum (Fig. 1). The microbial exploration technology (MET) was conducted simultaneously with Oxy's seismic program in which the seismic company collected 1,513 soil samples to be analyzed by EBT.
This article compares the results of EBT's geomicrobial survey of Ecuador's Block 15 with post-survey drilling results.
In the 15 years since EBT's MET survey, ownership of Block 15 has been transferred to PetroAmazonas EP (PAM). EBT, working with PAM, has correlated MET survey results with drilling and production data for Block 15. It is important to note that PAM completed all its drilling without using the information contained within EBT's Block 15 report, dated 1999.
Operators have drilled more than 100 wells in Block 15, 47 of which were within EBT's MET survey coverage. According to EBT's MET survey, 18 of these 47 wells would have been recommended as probable targets for development. While all 47 wells were successfully completed, the 30 nonrecommended locations had an average cumulative production of 213,000 bbl of oil and the recommended locations had an average cumulative production of 1.47 million bbl of oil. A more in-depth comparison will be presented later.
Microbial exploration
MET is based on three physical and biological principles.
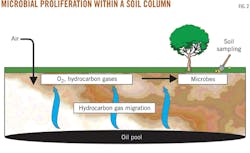
• The technology assumes that oil or gas reservoirs will have a certain amount of hydrocarbon gas that migrates to the surface (Fig. 2).
• These gaseous hydrocarbons serve as a nutrient source to soil micro-organisms in aerobic near-surface zones.
• Once an oil or gas reservoir undergoes production, the near surface MET signal over the produced area of the reservoir decreases. Gas now migrates more easily through the wellbore rather than through the overburden.
MET technology is capable of identifying the level of micro-organisms present in near-surface soils in response to the amount of hydrocarbon gases migrating from subsurface petroleum deposits. EBT develops the MET value by judging the population levels of the hydrocarbon-degrading soil micro-organisms.
With these principles, MET survey technology can be deployed both onshore and offshore. For offshore surveys there is enough oxygen in the water to create an aerobic environment in the sediment layers for the micro-organisms to flourish, as long as a gaseous hydrocarbon nutrient source is available.
In all survey work the soil samples have to be collected deep enough to eliminate error from surface contaminants and organic materials. The soil samples, however, cannot be taken from a depth below where oxygen can permeate the soil column.
After the laboratory analysis, EBT generates an MET value for each sample location. EBT then uses these MET values to create seven maps to analyze how the individual MET values compare to the entirety of the MET survey.
The final map that EBT produces is called the percent probability of drilling success map (%PS Map). This %PS Map is how EBT evaluates and recommends well locations.
Locations that have a %PS value of 45 or greater are recommended for exploratory wells. For development wells, EBT uses a lower %PS value because of the effect the producing wells have of drawing the signal strength away from the surface. As mentioned, gas will take the path of least resistance to the surface.
Supplemental technology
MET survey technology is often deployed jointly with seismic surveys. MET technology can identify areas of hydrocarbon interest on the surface, but it cannot define the structures or traps that are involved in the subsurface.
Conversely, seismic surveys can identify the subsurface structures and traps but are less effective in defining how well traps and structures are charged with hydrocarbons. Using both seismic and MET together improves the success rates, compared with using either technology alone.
Given the price of an MET survey, $3-5 an acre, and better definition for further seismic shoots, MET surveys are often carried out before the seismic survey.
In addition, both surveys can be conducted simultaneously, as in the case for Block 15. EBT trained the seismic crew how to collect MET soil samples. As the seismic crew conducted its survey, it collected the MET soil samples to be sent to EBT's laboratory.
This method eliminates the need to mobilize two field crews but removes the benefit of using the MET survey to design where to conduct the seismic survey. The cost of an MET survey when run in conjunction with a seismic project is in the range of $400-600/km, a fraction of the cost of shooting seismic.
MET, drilling results
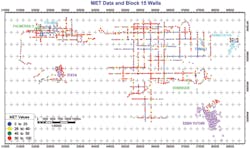
Fig. 3 shows the actual MET sample locations and the location of all wells drilled in Ecuador's Block 15. Note that not all wells on this map are reviewed because they lie outside of the MET coverage area.
There is a strong correlation between a higher %PS value and a higher rate of successful well completion. In 1999, Occidental Petroleum presented EBT with maps of Block 15 after completion of the MET survey. These maps showed the location of five presurvey dry wells: the Las Palmeras, San Rouge-1, San Rogue-2, San Rogue-3, and the Tangay wells. None of these wells would have been recommended by the MET survey.
In Block 15, EBT's MET data recommended the drilling of 18 wells. All of the recommended well locations were successfully completed with high production numbers. EBT successfully recommended 18 of 18 well locations that were completed and did not recommend any of the five dry wells.
Thus, recommending drilling locations based on %PS values displayed 100% accuracy in this post-drilling scenario. While this process proved successful in Block 15, results often vary. EBT maintains a success rate of 81%. This completion rate, based upon 2,423 wells that have been drilled pre and post-survey, in our MET surveyed area, is 22.5% more successful than the industry's drilling success rate of 58.5%.
Nonrecommended wells
The question arises as to why EBT did not recommend the other 25 wells that were drilled and completed in Block 15. MET survey recommendations are ranked through statistical analysis and highlight areas of highest potential. This does not imply nonrecommended locations will not produce oil and gas.
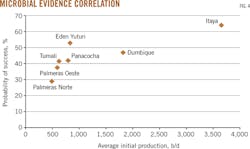
What it means, based on a review of post-survey wells drilled in EBT's survey areas, is that locations recommended by the MET survey will have higher production and will be completed at a higher rate than wells drilled in nonrecommended locations (Fig. 4).
There is a strong correlation between a higher %PS and a higher initial oil production (IOP). We used the average IOP for this review instead of average cumulative production to reduce the effect that recent successful wells drilled would have on lowering the average cumulative production due to their shorter production history.
We feel that the average IOP gives a more accurate view of the success of these wells. The best field from this review is Itaya field, which has an average %PS value of 64.2% and an average IOP of 3,650 bo/d. The second best field is Dumbique field, which has an average %PS value of 47% and an average IOP of 1,840 bo/d.
The least productive field is Palmeras Norte field, which has an average %PS value of 29% and an average IOP of 486 bo/d.
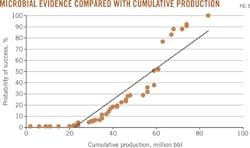
Nonrecommended locations can still have production (Fig. 5). As shown, some of these locations have production and several have IOPs of 1,000 bo/d or greater; the average IOP of nonrecommended locations is 567.8 bo/d. This is lower than the average IOP of all recommended locations, which is 2,130 bo/d. In the case of Block 15, the MET-recommended locations were almost four times more productive on average than nonrecommended locations.
Another way to review the success of the MET survey in Block 15 is to look at the total cumulative production of all the wells reviewed and compare that value with the %PS values of the wells.
We asked the question, what percent of the total oil produced was from nonrecommended locations compared with recommended locations? The total cumulative production of the reviewed wells is 32.9 million bbl of oil. The 30 nonrecommended wells accounted for 19.4% of the total production, or 6.4 million bbl of oil. That means that the 18 recommended post-survey wells accounted for 80.6% of the total production, or 26.5 million bbl of oil.
Based on these numbers, the nonrecommended wells have an average cumulative production of 213,000 bbl of oil. The recommended wells have an average cumulative production of 1.47 million bbl of oil.
Recommendations, results
MET technology was successful in identifying the six new fields in Block 15, although it is important to note that all of the drilling in this block was completed without knowledge of EBTs' MET survey.
MET technology can increase both drilling success rate and production. In Ecuador's Block 15, wells that were rated below 20 %PS (6 wells or 12.7% of wells) had only 0.9% of total production from the 47 wells within the survey.
Wells rated below 30 %PS (14 wells or 29.8% of wells) had only 5.3% of total block production.
Wells recommended by the MET survey on the other hand (greater than a 45 %PS) had 80.6% of total production (18 of 47 wells or 38.3% of wells).
In Ecuador's Block 15, an estimated well cost of $6.5 million would require an investment of $195 million to drill and complete the non-MET recommended wells in this survey. With a cumulative production of 7.3 million bbl of oil, the development cost averages $26.71/bbl.
For the MET-recommended wells in this survey, the total cost for drilling and completion would be $110.5 million. With a cumulative production of 25.58 million bbl of oil to date, the development cost would average $4.32/bbl.
As PetroAmazonas EP continues to drill, microbial exploration technology could further target probable success on a per-well basis. To date, operators have discovered 30 oil fields, including five giant fields. Even though exploration activity has increased, it remains in the early-to-medium stages of a new and already successful phase.
Acknowledgement
The author acknowledges Jorge Vallejo and Marlon Diaz at PetroAmazonas EP, Quito, Ecuador, for their contribution to this study.
EXPLORATION &
DEVELOPMENT
The author
Jeff Munnecke ([email protected]) is chief operating officer at Environmental BioTechnologies Inc., Lodi, Calif. He has also served as a lab technician and then lab manager at EBT. He holds an AA in liberal studies from Cabrillo College, Aptos, Calif., and is continuing his education in environmental studies and business administration at California State University, Sacramento. He is a member of the Independent Petroleum Association of America.
More Oil & Gas Journal Current Issue Articles
More Oil & Gas Journal Archives Issue Articles
View Oil and Gas Articles on PennEnergy.com
