Premature transition to boundary-dominated flow limits reserve estimates
Scott Lapierre
Shale Specialists LLC
Houston
Application of multi-fractured horizontal well bores to the recovery of oil from ultra-low permeability reservoirs presented a difficult paradigm shift for operators, service providers, and the investor community. To attract capital and enable the investing public to model financial returns and production growth, operators published expectations of production over time in the form of type curves along with number of viable drilling locations at a given well spacing and stimulation intensity. For West Texas’s Midland basin, published type curve-expectations invariably contained an infinitely relaxing and prolific initial hyperbolic transient decline component (bexp) significantly higher than unity, intentionally made finite with a later transition to exponential decline invoked with a minimum rate of decline (Dmin) and a minimum economic production rate limit. The less prolific exponential second segment implicitly represented operators’ anticipation that prolific transient decline would inevitably undergo severe degradation upon the reservoir’s transition to boundary-dominated flow (BDF). By publishing type curve-expectations with single-digit values for Dmin, Midland basin operators plainly stated that inevitable degradation in oil decline would occur multiple decades into the life of a well.
Through 2019, after nearly a decade of experimentation with well spacing and stimulation intensity, published type-curve expectations had only received upward revisions while drilling inventories remained unchanged. Publication of type curves dissipated almost entirely by early 2019, and the technical literature lacks critical analysis of the viability of late-life transition assumptions for which a historical precedent never existed.
To study long-term late-life production in unconventional wells, six field cases from across Midland basin are provided herein using production data downloaded from the Railroad Commission of Texas (RRC) website. Five multi-well cases with varying well spacings and stimulation intensities were selected. These cases, along with a rare unbounded standalone well, were analyzed for evidence of historical BDF transition. Strictly objective processes were used to measure the day of BDF transition and generate a history match using two-segment Arps-type decline-curve analysis (DCA).1 Where possible, vintage-appropriate published type curves, obtained from investor presentations, were compared with state-reported production. In the absence of a published type curve, traditional dual-segment DCA was used with a 7.5% Dmin to accommodate the popularly assumed late-life BDF transition.
Additionally, a novel proprietary analytical solution capable of predicting BDF transition exclusively from transient data published by the current author was applied to test whether the technology may be suitable for closing the model-measure-optimize loop associated with designing economically and environmentally sustainable infill drilling programs.2-4
Field cases
Given limitations of public data, particularly the Texas regulatory-body lease-level (as opposed to well-level) reporting requirement, coupled with a preponderance of multi-well leases, only a minority of horizontal wells in the public database qualified for this study. Candidates had to meet the following criteria:
- Production recorded for a horizontal well must not be contaminated with vertical wells.
- Production must be traceable to individual well entities and possess complete RRC W2 form documentation and FracFocus data.
- When multiple wells are placed on production (PoP’d) in delayed fashion, positive or negative frac hits must be minimal.
- Production must register a historical BDF transition.
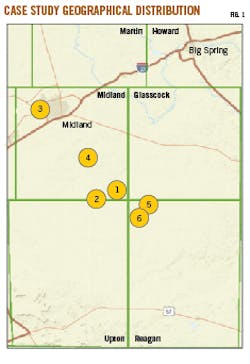
Five multi-well cases with varying well spacings and stimulation intensities were selected from the RRC website. A sixth case consisted of a single well that was unperturbed and unbounded for the first 2,000 days. Geographical distribution of the selected cases is displayed in Fig. 1 and basic identifying information is listed in the Table.
Type-curve deconstruction
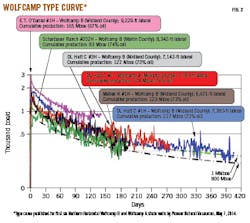
Slide #11 from Pioneer Natural Resources Co’s first-quarter 2014 investor presentation portrayed time-based boe/d data from six early Wolfcamp wells in their northern acreage centered around a 1-million boe type curve (Fig. 2). Average oil in volume was 74.2% which, assuming a two-stream 6 Mcf-to-1 bbl energy equivalence, implies a gas-oil ratio (GOR) of 2,090 scf/bbl for the life of the well. The dashed 1 MMboe type curve was digitized via the points and coordinate system shown in Fig. 2.
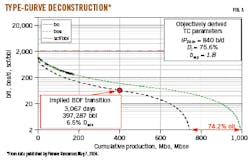
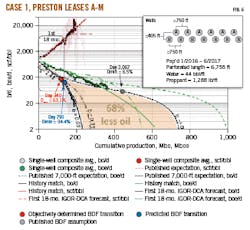
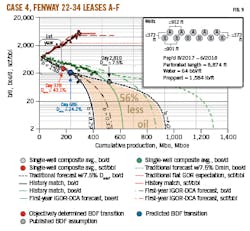
Digitized boe/d datapoints from the slide were imported into a spreadsheet and multiplied by 74.2% to create the underlying bo/d. A hyperbolic decline equation was best-fit through oil production and determined, assuming an economic cutoff of 2 bo/d, an estimated ultimate recovery (EUR) of 742,000 bbl, an underlying initial decline (Di) of 75.6%, and bexp = 1.8 (Fig. 3). Interrogation of the full rate-versus-time oil series revealed that this operator assumed oil decline would undergo the theoretical degradation associated with an inevitable transition to BDF roughly 3,067 days and 397,287 bbl into production (Dmin ≈ 6.5%). Given that the published data were normalized to represent a 7,000-ft completed length, the deconstructed two-stream type curve was compared with 13 wells in Case 1, PoP’d from January 2016 through June 2017 and completed to a length of 6,755 ft by the same operator.
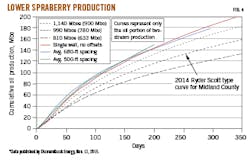
Slide #18 from Diamondback Energy Inc.’s third-quarter 2015 investor presentation showed cumulative oil production versus time for three Midland County well groups spaced 500, 660, and infinite feet apart (Fig. 4). Production was slightly above a 900,000-bbl and 1.14 million-boe type curve.
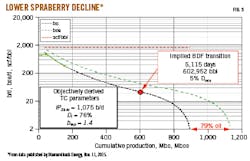
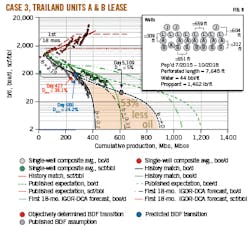
Digitized bo/d datapoints from the 1,140 Mboe curve were imported into a spreadsheet. A hyperbolic decline equation was best-fit through the oil phase data and determined, assuming an economic cutoff of 2 bo/d, an EUR of 900,000 bbl, an initial decline (Di) of 76%, and bexp = 1.4 (Fig. 5). Interrogation of the full rate-versus-time oil series revealed that this operator assumed oil decline would undergo theoretical degradation associated with inevitable transition to BDF roughly 5,115 days and 602,952 bbl into production (Dmin ≈ 5%). Given the published data were normalized to represent a 7,500-ft lateral, the deconstructed two-stream oil series was multiplied by a factor of 1.33 before comparison with the 26 10,000-ft wells in Case 3, PoP’d from July 2017 through October 2018 by the same operator.
Composite averages
Multi-well leases were consolidated into a single representative composite -average well. All wells’ first producing months were initialized together regardless of date PoP’d. The sum of aligned consecutive months is computed and divided by the total number of wells reporting to the lease for that month. Single-well composite averages were required to work through regulatory body limitations requiring production reporting by lease and not by individual well. Case 1 and Case 6 were comprised entirely of single-well leases.
History matching
An initial transient oil forecast segment was generated for each case by regressing an Arps hyperbolic-decline equation through the first 18 months of production for Cases 1, 3, and 6 and the first year for Cases 2, 4, 5. Varying time periods were required to accommodate the low signal-to-noise ratio inherent with monthly, lease-level resolution.
The parameters for Di and bexp were selected via a root mean square error (RMSE) minimization process tracked after each iteration proceeding from an initial guess. Then, for consistency with operator-assumed late-life BDF transitions manifesting as exponential decline, Dmin and the actual day of BDF transition were solved for using repeated iterations of the RMSE minimization process on full production histories. Once the day of BDF transition was determined, the iterative RMSE minimization process was repeated on the full production history to solve for bexp that most accurately reproduced production history observed in the single-well composite average.
A gas-phase production hindcast-forecast was generated using the best fit of a linear equation through the first 12 or 18 months of GOR versus cumulative produced oil. Regression was anchored through the first month before GOR escalation above initial gas saturation, when bottomhole flowing pressure was presumed to fall below bubblepoint. The resulting GOR-versus-cumulative produced oil transform was combined with the initial unrestricted hyperbolic transient oil forecast to reproduce the gas-rate-versus-time series. Gas- and oil-phase forecasts were then combined using a 6 Mcf/bbl energy equivalence to generate the total combined production forecast on a two-stream basis. A GOR threshold was then selected via a third RMSE process on boe data to reproduce a final boe forecast.
Predicting BDF transition
All production-decline analysis (PDA) technologies available before 2021 lack intrinsic mechanisms for predicting future transitions to BDF when applied only to transient data. Much literature exists describing uncertainty from non-unique solutions encountered when multi-segment forecasts are generated using only transient flow data.5 By leveraging the thoroughly modeled and validated ancillary effect of marked escalation in GOR coincident with severe degradation in oil decline upon transition to BDF, however, this work combines unrestricted transient GOR and oil forecasts to project total system energy production (two-stream boe/d) into the future.6-8
Since boe can be defined as a specific unit of energy, an energy balance of a closed system dictates that boe/d can never rise, especially in cases in which total fluids production from finite-reservoirs are in decline and external energy (from increasing artificial lift energy, frac-hit, etc.) is not added. Any future runaway increase in boe/d indicated by unrestricted transient total energy projection, therefore, requires a proportional increase in produced-fluid energy density (i.e. % oil). Since there is no rational basis in established reservoir theory for reservoirs of finite size, gravitational, and mechanical potential energy to “oil up,” proactive termination of a transient forecast segment to prevent a physically irrational increasing rate of energy production is justified.
Field examples
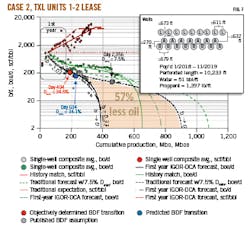
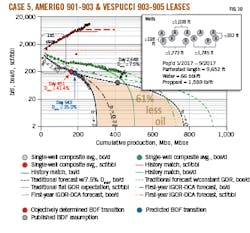
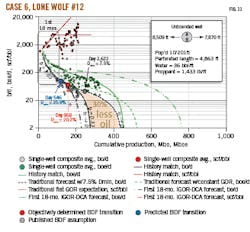
Each field case is summarized by two log-plot formats (Fig. 6-12). The first type (Fig. 6-11) is logarithmic bo/d, boe/d, and scf/bbl plotted against linear cumulative produced oil and oil equivalent. Data for boe were computed on a two-stream basis using a 6 Mcf/bbl energy equivalence. Each of the three data groups have three versions presented:
- Full-production history match.
- Either published type-curve or traditional forecast method with single-digit Dmin according to the Table.
- Early-time forecasts generated with iGOR-DCA prediction software.
Red circles denote objectively determined historical days of BDF transition while grey and blue circles represent anticipated and novel predicted days of BDF transition, respectively. Individual well production is shown to exemplify a composite single-well average responding to dynamic variability in subcomponents (Fig. 6).
Well-spacing diagrams and completion details are displayed in the inset box in the top right. Decline exponents used for each are labeled parallel to the termini of the three sperate phase forecasts. A b ➝ 0 symbol denotes that a Dmin was invoked, whereas b = [value] symbol denotes that a near exponential, subharmonic decline was used to accommodate the BDF segment. A semitransparent Dmin label also designates when a subharmonic BDF was invoked, whereupon the indicated value represents the tangential hyperbolic decline at the start of BDF. A proprietary method was used to determine bexp in the iGOR-DCF forecasts.
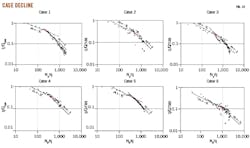
The second type of log plots contains traditional rate transient analysis (RTA) for all six cases, referenced to traditional slope values denoting transient and boundary-dominated flow regimes after Lee, et al. (Fig. 12).9 RTA plots normalized flow rate (q/Qmax) against material balance time (Np/q), where q is instantaneous flow rate, Qmax is maximum observed daily flow rate, and Np is current cumulative production. These axes and parameters are standard plots for RTA in the absence of bottomhole flowing pressures. Lines of -½ and -1 slope are drawn to intersect the objectively determined day of BDF transition (denoted by red circles). Poor alignment of actual data with theoretical slope lines is likely due to subcomponent wells underlying the single-well composite average being in various, unresolvable stages of encountering hard boundaries of the individual reservoir compounded by low-resolution monthly data.
Discussion
The 73 wells constituting the six cases provided herein were intentionally selected for their premature transitions to BDF. Studies have shown that early transitions are widespread, universal, predictable, shorten production life, and shorten cumulative oil recoveries.10-13 Historically, Dmin ranging from 21% to 31% were observed in 3,086 wells collectively displaying BDF transitions 949 days on average into production.14 Examples from 206 wells representing roughly $1.7 billion of drilling and completion capital from the operator of Case 1 reveal widespread material shortfalls in oil production due to unanticipated premature transition to BDF.15
The 2,000 days of production from the rare, isolated unbounded Case 6 in the core of Midland basin suggest late-life transition assumptions with single-digit Dmin were never appropriate for standalone parent wells. Additionally, unaccounted depletion effects from decades of legacy vertical production in Midland basin, having received little accounting in the literature, might contribute to widespread observed transition to BDF within Midland’s core counties.
These data show that severe degradation in transient decline within the first 5 years of production is common at any spacing in Midland basin. As demonstrated in rate-cumulative oil plots, published type-curve expectations using traditional late-life assumptions for BDF transition appear overoptimistic when drained reservoir volume of fully bounded wells present no-flow boundaries to one another. It is only slightly less optimistic for the standalone case isolated from offset producers by greater than 1.5 miles.
The methodology in this paper improves reliability of analytical forecasts generated from early time data and enables more rapid early time assessment of spacing and stimulation intensity experimentation. Though optimistic for the bounded cases and pessimistic for the standalone case, the +19.5% average percent error in oil EUR was a marked improvement over the +44% average error of published type curves and use of single-digit Dmin.
Finally, it is worth noting that while a novel method for integrating GOR into PDA was demonstrated herein via Arps DCA, the method’s core basis in considering total energy production from a transient system is applicable to all other existing PDA methods including, but not limited to RTA, numerically enhanced RTA, flowing material balance, and modern type-curve analyses.
References
- Arps, J., “Analysis of decline curves,” Transactions of the AIME Vol. 160, No. 1, 1945, pp. 228-247.
- Lapierre, S.G., “Integration of Gas-to-Oil Ratio into Production Decline Analysis to Predict Flow Regime Transition,” URTEC-2021-5102-MS, Unconventional Resources Technology Conference, Houston, Tex., July 26–28, 2021.
- Lapierre, S., “Method for forecasting well production and determining ultimate recoveries using bubble point decline curve analysis,” US Patent No. 10,012,056, July 3, 2018.
- Lapierre, S., “Iterative determination of decline curve transition in unconventional reservoir modelling,” US Patent No. 10,634,815, Apr. 28, 2020.
- Mattar, L., and Anderson, D.M., “A systematic and comprehensive methodology for advanced analysis of production data,” SPE-84472-MS, SPE Annual Technical Conference and Exhibition, Denver, Colo., Oct. 5-8, 2003.
- Clarkson, C.R. and Qanbari, F., “An approximate semianalytical multiphase forecasting method for multifractured tight light-oil wells with complex fracture geometry,” Journal of Canadian Petroleum Technology, Vol. 54, No. 6, 2015, pp. 489-508.
- Jones, R.S., “Producing Gas-Oil Ratio Behavior of Tight Oil Reservoirs,” URTEC-2016-2460396, Unconventional Resources Technology Conference, San Antonio, Tex., Aug. 1-3, 2016.
- Khoshghadam, M., Khanal, A., Yu, C., Rabinegadganji, E., and Lee, J., “Producing gas-oil ratio behavior of unconventional volatile-oil reservoirs, and its application in production diagnostics and decline curve analysis,” URTEC-2670925-MS, SPE/AAPG/SEG Unconventional Resources Technology Conference, Austin, Tex., July 24-26, 2017.
- Lee, J. and Sidle, R., “Reserves Management Best Practices Workshop,” 3esi-Enersight Workshop, Houston, Tex., July 12, 2018.
- Lapierre, S.G., “Bubble-Point Death and the PXD Oil Mix Challenge: Part I,” LinkedIn, July 17, 2017.
- Lapierre, S.G., “Bubble-Point Death and the PXD Oil Mix Challenge: Part II,” LinkedIn, Oct. 16, 2017.
- Lapierre, S.G., “Wall Street Journal Validates Predictions Made by Controversial Bubble-Point-Death Articles,” LinkedIn, Jan. 10, 2019.
- Lapierre, S.G., “On the Nature and Character of the Widespread Oil Production Shortfalls Reported by The Wall Street Journal,” LinkedIn, Sept. 11, 2019.
- Lapierre, S.G., “Bubble-Point Death and the PXD Oil Mix Challenge: The Final Word,” LinkedIn, Nov. 1, 2021.
- Bowie, B. and Ewert, J., “Numerically Enhanced RTA Workflow–Improving Estimation of Both Linear Flow Parameter and Hydrocarbons In Place,” URTEC-2020-2967-MS, Unconventional Resources Technology Conference, virtual, July 20–22, 2020.
The Author
Scott Lapierre ([email protected]) is head of innovation at Shale Specialists LLC, Houston. He has also served as managing director-principal at PCORE Exploration & Production LLC and as geoscience advisor for Pioneer Natural Resources. He holds a BS (1995) from the University of South Alabama. He is a member of Society of Petroleum Engineers (SPE), American Association of Petroleum Geologists (AAPG), Society of Petrophysicists, and the Society of Professional Well Log Analysts (SPWLA).
