China integrates flow assurance at its first deepwater gas field
Based on “Flow Assurance Challenges for China’s First Deepwater Gas Field Development in South China Sea,” SPE-202254-MS, SPE Asia Pacific Oil & Gas Conference and Exhibition, Perth, Oct. 20-22, 2020.
China’s first deepwater gas field development sits 100 km offshore in the South China Sea. The field will produce through a semisubmersible rig in about 1,500 m of water with recorded seabed temperatures below 4 °C. Eastern and western loops of the subsea production system (SPS) span more than 40 km and are sized to the total number of production wells. The entire system includes topsides, subsea flowlines, risers, and subsea manifolds. The long subsea tiebacks, combined with high pressures and low temperatures, require an integrated flow assurance management strategy.
A dedicated flow assurance team managed risk by integrating subsurface, drilling, completions, umbilicals, risers, flowlines, control and instrumentation, and topsides process engineering.
Flow risks were identified by grouping more than 10 deepwater subsea production wells in the early feasibility study by reservoir types, predicted water cuts, and production tubing sizes to bound the operating envelope. Flow assurance analysis was carried out for well unloading, well test, pre-commissioning, first gas, steady-state production, planned and unplanned shutdowns, and hot and cold starts. Risks were flagged for respective teams to produce flow assurance recommendations for the overall operating guidelines and procedures.
Thermohydraulic modelling
Initial benchmark studies using commercial thermohydraulic numerical simulation on three sets of deepwater gas wells yielded significant and consistent discrepancies between predicted and measured temperature profiles. Parameters related to South China Sea’s deepwater wells were incorporated in the models to improve modeling results for this specific region.
Key parameters included pressure, temperature, flow rates, and flow test duration. Parameters were benchmarked at bottom hole, seabed, and sea surface (the topside measuring point). Revised models will capture transient thermohydraulic results as they become available for well tests and startups.
Differences in pressure between revised benchmark model predictions and measurements were less than 1 MegaPascal (MPa) at bottom hole and topsides for both low and high rates. Table 1 shows temperature matches between prediction and measurement. The largest temperature difference is < 7 °C. for high test rates at the bottom-hole location. Given higher temperatures at bottom hole within the reservoir, this is about an 8% deviation in temperature prediction.
Cyclones
Tropical cyclones are common in the South China Sea with highest occurrence in August and September. These require safe and efficient production rampdown and shutdown of the entire system. Restart operations require ramping up to final rates quickly while leaving no permanent damage to wells and the SPS. The flow assurance program has a matrix of detailed shut-down and restart simulations for both planned and unplanned scenarios. Well shut-in sequence, bean-up, and bean-down schedules are customized for each well.
Chemical dosage for hydrate and scale inhibition before shutdown or hot and cold restarts are also included in the recommend operation guidelines. These guidelines are followed to protect the entire system even if it is not producing during cyclone events.
The guidelines are especially important during late field-life with declining reservoir pressure, when individual wells may not be able to resume full production due to water loading or higher back-pressure related to accumulated liquids in low points of the flow paths.
Subsea riser sizing
Optimum riser sizing is critical to overall economics, production, and operations throughout field life. Critical issues are throughput capacity during early life and riser slugging during late life.
Benchmarked numerical models studied riser sizing for eastern and western production loops based on the number of wells and expected productivity for each loop. Results from the western loop are described below.
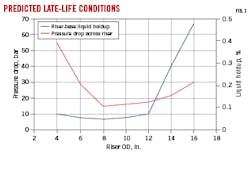
Fig. 1 shows late-life pressure drop and liquid holdup calculations based on riser size. Predicted riser-base liquid holdup increases significantly for risers greater than 12-in. OD, and pressure drop increases significantly for risers less than 8-in. OD.
Undersized risers add complications beyond pressure loss. During early life production, an undersized riser not only restricts maximum production rates, but also induces large Joule-Thomson (J-T) cooling, reducing fluid temperatures through the riser and leading to embrittlement and hydrate formation.
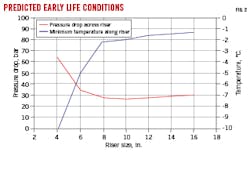
Fig. 2 shows steady-state early life riser pressure drop and temperatures with respect to riser size. As with late-time calculations, pressure drop increases dramatically for risers larger than 8-in. OD, while steady-state minimum temperatures dramatically decrease for risers smaller than 8-in. OD.
Combining early- and late-life riser studies, optimum riser sizes were determined to be between 8 and 12 in. OD. Additional considerations for refining riser selection include additional capacity for future tie-ins, riser cost, and ease of riser installation using existing offshore facilities.
The production loop is designed to assign each well’s production to either northern or southern flowlines within each of the two production loops. This assignment mitigates slugging by tailoring rates and water cuts to specific flowlines and risers.
Hydrates
Among the three hydrate structures (referred to as structures I, II, and H), only structures I and II are typically found in oil and gas production and processing.1 Hydrates form naturally in deepwater environments from combinations of high pressure, low temperature, methane, and water in the production stream. Gas hydrate blockage is a common flow assurance challenge in these environments.
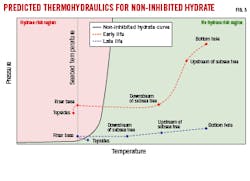
Fig. 3 shows predicted pressure-temperature (P-T) regimes for gas in the proposed subsea development during early and late life steady-state operations. Regions from bottom hole through to topsides are plotted against a noninhibited hydrate disassociation curve (hydrate dissociation prediction is chosen over hydrate formation as the former is slightly more conservative). Hydrates are expected to form left of the curve. For flowlines more than 20 km, hydrate blockage is predicted at riser base and topside locations for early-life production and only at the riser base for late-life production.
During early steady-state flow, fluids lose heat from bottom hole through topsides. Significant pressure and temperature drops are observed upstream and downstream of the subsea tree due to J-T cooling effects as fluids move across the subsea tree production-choke valve. This is exacerbated by the higher levels of choking needed while reservoir pressure is relatively high during early life.
During late life steady-state flow, depletion lowers fluid velocities and temperature continuously drops from bottom hole to riser base. Temperature increases, however, when fluids move from riser base through topsides. In this region, fluids have longer residence times in the riser due to lower flow rates than during early life and gain heat from ambient sea water while moving from low-temperature seabed to higher-temperature sea surface. Only the riser base suffers from hydrate blockage.
Hydrate management strategy stops hydrates from forming in the first place, eliminating expensive and dangerous production stoppages and hydrate clean-outs. Hydrate inhibition needs to account for first start up, turn down, blow down, shut down, restart, steady state, and transient production. Thermodynamic inhibitors are used with adequate safety margins to cover uncertainties in field data or simulations. Two hydrate inhibitor regeneration units are installed topsides which cover the required capacities during field life and minimize environmental impact. Proper inhibitor dosage is recommended by the flow assurance team for all steady-state and transient scenarios.
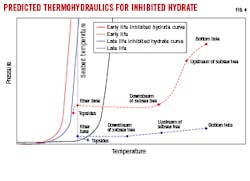
Fig. 4 shows early and late life steady-state thermohydraulics at key flow path locations, plotted against inhibited hydrate dissociation curves. Inhibitor dosage is optimized differently for early and late field life, resulting in separate curves for each. With the inhibitor program, the entire system is fully protected against hydrate formation and blockage.
Scale
Scale precipitation predictions revealed scaling risks based on representative water sample compositions. Carbonate scales were expected to form along production tubing, and mitigation measures based on quantitative scale predictions were incorporated into the production program using continuous downhole scale inhibitor injection.
The scale management system includes topsides chemical storage and pumping, dedicated subsea umbilical lines, dedicated downhole scale inhibitor injection lines, and chemical injection metering valves. Laboratory compatibility tests ensure that the selected scale inhibitor is fully compatible with production fluids and hydrate inhibitors. Dedicated scale inhibitor injection lines and valves provide independent control over injection, avoiding deliverability problems to the system.
With continuous use, periodic system purging is unnecessary, resulting in a more robust system. As field data and fluid samples are obtained over the life of the field, scale inhibitor compositions and dosage will be periodically tested and adjusted, if necessary.
Other flow concerns
Lower-level flow assurance risks include sand production and wax formation. Sand loading predictions for the field upgraded safety margins with respect to erosion for all hardware, especially production tubing and subsea manifolds. Sand detection is incorporated into the subsea design as a check against predicted sand production. With this system, operators can quantify sand production over the field life and adjust rates accordingly as part of an overall sand management strategy.
Laboratory tests on representative fluid samples showed relatively low wax appearance temperatures, indicating that the production system has low paraffin wax precipitation risk. A wax management strategy was developed, however, to mitigate against wax deposition arising from waxy condensates from future nearby development tie-ins. Wax precipitates can come not only from crude oil but also gas condensates with relatively light hydrocarbons, especially when condensates from different origins or compositions mix.
In case of wax deposits, the entire production system is designed to be fully piggable with round trip pigging taking advantage of the flow loop design and constant internal diameter of the flowline, riser, and jumper. Pigs can be launched from topsides, pumped across the flowline crossover, and received at pig receivers back at topsides. Gas pigging in flowlines requires managing liquid accumulation and surge in front of the pig using bypass pigging, accurately and timely control of pig movement, and reducing pig velocities to an acceptable level while moving up the steep riser. The flow assurance team created operating guidelines for sequential pigging during early, middle, and late field-life scenarios.
The flow assurance team will continuously benchmark models against field observations throughout the life of the field. In addition to steady-state operations, the process will fine tune models for transient activity, such as well restarts. Field data will be delivered to the production management system to further support operations with online monitoring and develop look-ahead and what-if scenarios.
References
- Sloan, D., Koh, C., and Sum, A.K., “Natural Gas Hydrates in Flow Assurance,” Gulf Professional Publishing, 2010.


