Western Egyptian desert reservoir shows high degree of heterogeneity
Mohamed Abd El-Nasser
Qarun Pet. Co.
Cairo, Egypt
Abdelwahab Bayoumi
Sayed Gomaa
Al-Azhar University
Cairo, Egypt
Abu Roash-G (ARG) is one of the major productive reservoirs in Egypt’s western desert. Routine core analysis characterized reservoir rock using Dykstra-Parsons and Lorenz coefficients (Lc). Both methods identified heterogeneity in ARG reservoir. The Lorenz coefficient was 0.56 while the Dykstra-Parsons coefficient (permeability variation factor) was 0.62, further indicating that ARG reservoir is heterogeneous, matching pressure data interpretation.
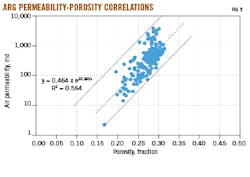
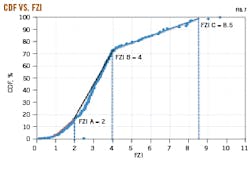
As a result of this heterogeneity, poor relationships exist between permeability and porosity. The hydraulic flow unit (HFU) technique identified and characterized the reservoir and indicated that it can be divided into three distinct units. Reservoir development, stimulation, and enhancement need to consider these HFUs.
Reservoir heterogeneity
Reservoir heterogeneity extends areally and vertically. Areal heterogeneity in terms of porosity and permeability is identified through drilling several development wells where logging and well tests measure spatial permeability. Porosity and permeability between drilled wells will remain questionable, however, and geologists define them with geostatistical modeling and readjust based on dynamic modelling.
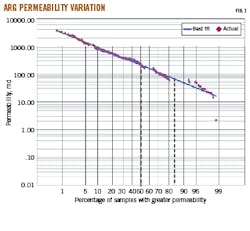
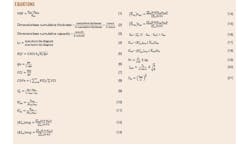
Dykstra-Parsons coefficient and Lorenz coefficient are common static measures of reservoir vertical heterogeneity. These measures describe the distribution of permeability in formation rock samples. Routine core data from 194 samples yielded Dykstra-Parsons coefficients by arranging permeability in descending order after removing broken or suspect data. Permeability values were plotted on a log scale versus sample percentages on a probability scale. A best-fit straight line was drawn through the points, and permeability values at 84.1% and 50% of samples determined a Dykstra-Parsons permeability variation factor (VDP) of 0.62 using Equation 1.
Lorenz coefficient
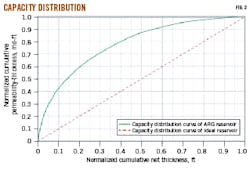
Core data allowed estimating Lc, arranging permeability in descending order after removing any broken or suspect data. Dimensionless cumulative thickness and dimensionless cumulative capacity were calculated and plotted. Lc = 0.56 using Equations 2–4. Figs. 1-2 show the permeability variation factor and capacity distribution for ARG, respectively.
Well correlation, pressure data
Wells correlations and pressure data reveal vertical and areal heterogeneities such as continuity between reservoir sand layers and well connectivity. Tracking layers across the entire reservoir reveals selected layers in some wells and marks their absence in other wells. A geostatistical model built from this information represents inter-well reservoir properties.
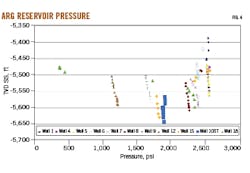
Fig. 3 shows stratigraphic cross sections and Fig. 4 shows pressure data for ARG which illustrate differences in sand layer thicknesses and high-pressure depletion in Sand-1 and Sand-2 caused by poor connectivity between wells. This depletion indicates sand pinch-outs beneath or at the edge of the reservoir which affect oil production stability, injection well water flooding response, and ultimate recovery.
Permeability-porosity relationship
Permeability is directly proportional to pore throat radius. Pore throats can be estimated using capillary pressure data from special core analysis and mainly depend on pore volume, grain shape, sorting, and size. There is no theoretical relationship between porosity and permeability in natural porous systems.
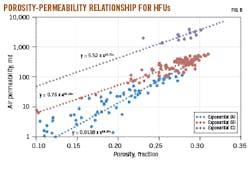
Porosity-permeability relationships come from a logarithm plot of permeability against porosity for a given core (Fig. 5). The wide range between lines cannot be represented by a single equation and therefore a best-fit straight line cannot represent the entire reservoir rock. This is addressed by the hydraulic flow unit (HFU) concept which defines porosity-permeability relationships for each rock type.
HFU
HFU is the representative volume of total reservoir rock within which geological properties controlling fluid flow are internally consistent and predictably different from properties of other rocks. A modified Kozeny-Carman mean hydraulic-radius technique identifies and characterizes a formation having similar hydraulic characteristics, or flow units, based on the microscopic measurements of rock core samples.
Reservoir quality index (RQI) is calculated on qualified cores using Equation 5. Porosity is normalized using Equation 6, and flow zone indicator (FZI) is calculated using Equation 7.
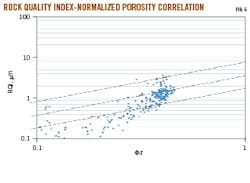
Calculated FZIs are arranged in ascending order with RQI plotted against ɸz on a log-log scale (Fig. 6). Samples with similar FZI (same rock characteristics) lie on a unit-slope line. The mean value of FZI can be determined from the intercept of the unit-slope line with ɸz = 1.
Relative permeability
Measuring relative permeability variations of several core samples from reservoir rock requires average relative permeability data from individual rock samples. These samples usually have different initial water and critical oil saturations and need to be normalized with all sample end points presented on a unit plot of Kr vs. Sw. They are then denormalized to obtain an average curve representing all samples for different reservoirs. The following steps describe the procedure of normalizing and denormalizing relative permeability data:
- Calculate normalized water saturation (S*w) for each set of relative permeability curves using Equation 9.
- Calculate normalized relative permeability to water (K*rw) at different water saturations using Equation 10.
- Calculate normalized relative permeability to oil (K*ro) at different water saturations using Equation 11.
- Select arbitrary values of S*w and determine average K*ro and average K*rw as shown in Table 2 using Equations 12-13.
Considering average Kro@Swc and average Krw@Sor given by Equations 14 and 15, respectively (Table 3), the last step calculates denormalization-relative permeability data to reflect actual Swc and Sor reservoir conditions using Equations 16-18.
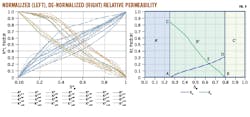
Special ARG core data yielded an average Swc = 0.23 and average Sor = 0.21. Relative permeability data were denormalized (Table 4) to generate the required ARG reservoir relative permeability curve. Fig. 9 shows normalized relative permeability (left) and denormalized relative permeability (right) for ARG.
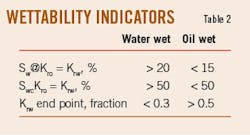
Table 5 distinguishes wettability preferences of a rock unit depending on connate water saturation and relative permeability characteristics. From these criteria, ARG reservoir is water wet because connate water saturation is 23%, water saturation at Kro= Krw is 63%, and Krw at maximum water saturation is 31%. Points A and B on the denormalized relative permeability curve represent endpoints at irreducible water saturation and residual oil saturation, respectively. End-point saturations determine movable saturation ranges and are directly related to the amount of recoverable oil. Also, relative permeabilities’ end points calculate the mobility ratio to estimate the sweep efficiency of a displacement process.
Point C is relative permeability to oil at irreducible water saturation. Point D is relative permeability to water at residual oil saturation. Point E represents water saturation at which water and oil relative permeabilities are equal and is an indicator of the wettability of the rock.
Region A’ represents water saturation below connate water saturation where water is immobile. Region B’ represents movable oil where it increases with distance between endpoints. Region C’ represents oil saturation below residual saturation where oil is immobile.
Capillary pressure
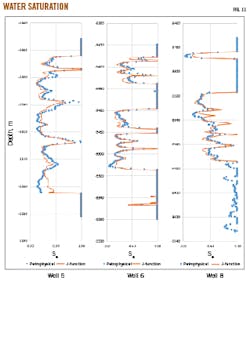
Saturation-height modeling generated capillary pressure curves. In this method, the J-function generates a generalized curve used in further steps to distribute initial water saturation for the reservoir simulation model.
Calculations follow these steps:
- Specify free water level (FWL, 5,580 ft MD in this case).
- Specify height above FWL to top of the reservoir.
- Specify oil and water gradients from repeated formation tester (RFT) data (ρo = 0.36 psi/ft and ρw = 0.44 psi/ft, respectively, in this case).
- Use calculated porosity and permeability from open-hole log petrophysical analysis and calculate water saturation based on relative permeability, capillary pressure, and electrical property data from special core analysis (SCAL).
- Calculate capillary pressure using Equation 19.
- Calculate J-function using Equation 20.
- Calculate Sw from J-function using Equation 21.
- Plot depth versus Sw and change parameters (a) and (b) until the calculated Sw matches water saturation calculated from petrophysical data.
- Calculating J-function parameters using this method results in a = 8.103 and b = -6.321.
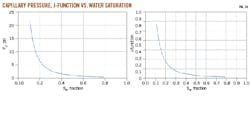
Fig. 10 shows the calculated capillary pressure and J-function vs. calculated water saturation. Fig. 11 shows the saturation calculated from the J-function matched to petrophysical data.
ARG capillary pressure
The capillary pressure curve in Fig. 10 is close to the origin, indicating that sand permeability matches routine permeability data. Capillary pressure data also indicate a short transition zone from oil to water.
Displacement pressure can also indicate wettability preference of the rock. A positive displacement pressure in an oil-displacing-water process indicates preferential wettability to water, and the relative magnitude of the displacement pressure reflects the strength of such wettability.
Bibliography
Abbaszadeh, M., Fuji, H., and Fujimoto, F., “Permeability Prediction by Hydraulic Flow Units Theory and Application,” SPE-30158, Petrovietnam Conference, Ho Chi Minh, Vietnam, Mar. 1-3, 1996.
Abu-Khamsin, S.A., “Basic Properties of Reservoir Rocks,” King Fahd University of Petroleum and Minerals, Dhahran, 2004.
Ahmed, T., “Reservoir Engineering Handbook,” Gulf Professional Co., London, Fifth ed., 2018.
Al-Ajmi, F.A. and Holditch, S.A., “Permeability Estimation Using Hydraulic Flow Units in a Central Arabia Reservoir,” SPE-63254, the 2000 SPE Annual Technical Conference and Exhibition, Dallas, Oct. 1–4, 2000.
Alharbi, A.M., “Experimental Evaluation of the Effect of Carbonate Heterogeneity on Oil Recovery to Water and Gas Injection,” PhD thesis submitted to University of Calgary, Department of Chemical & Petroleum Engineering, 2013, pp. 11-12.
Ali, S.S., Hossain, M.E., and Abdulraheem, A., “Hydraulic Unit Estimation from Predicted Permeability and Porosity Using Artificial Intelligence Techniques,” SPE-164747, North Africa Technical Conference and Exhibition, Cairo, Egypt, Apr. 15–17, 2013.
Amaefule, J.O., Altunbay, M., Tiab, D., Kersey, D.G., and Keelan, D.K., “Enhanced Reservoir Description Using Core and Log Data to Identify Hydraulic Flow Units and Predict Permeability in Uncored Intervals/Wells,” SPE-26436, Annual Technical Conference and Exhibition, Houston, Oct. 3-6, 1993.
Archer, J.S. and Wall, C.G., “Petroleum Engineering Principles and Practice,” Graham & Trotman Ltd., London, 1986.
Borhani, T.N.G., and Emadi, S.H., “Application of Hydraulic Flow Units and Intelligent Systems for Permeability Prediction in a Carbonate Reservoir,” The 3rd CUTSE International Conference Miri, Sarawak, Malaysia, Nov. 8-9, 2011.
Deghirmandjian, O., “Identification and Characterization of Hydraulic Flow Units in the San Juan formation, Orocual field, Venezuela,” MS thesis submitted to Texas A & M University, 2001.
Desouky, S.E.D.M., “Predicting Permeability in Un-Cored Intervals/Wells Using Hydraulic Flow Unit Approach,” PETSOC-05-07-04-P, Journal of Canadian Petroleum Technology, Vol. 44, No. 7, July 2005.
Fitch, P., Davies, S., Lovell, M., and Pritchard, T., “The Petrophysical Link between Reservoir Quality and Heterogeneity: Application of the Lorenz Coefficient,” SPWLA-2013-Q, SPWLA 54st Annual Logging Symposium, New Orleans, June 22, 2013.
Harrison, B. and Jing, X.D., “Saturation height methods and their impact on volumetric hydrocarbon in place estimates.” SPE-71326-MS, SPE Annual Technical Conference and Exhibition, New Orleans, Sept. 30-Oct. 3, 2001.
Jensen, L. and Currie, I.D., “A new Method for Estimating the Dykstra-Parsons Coefficient to Characterize Reservoir Heterogeneity,” SPE-17364-PA, SPE Reservoir Engineering, Vol. 5, No. 3, Aug. 1, 1990, pp. 369-374.
Kramers, J. W., “Integrated Reservoir Characterization from the Well to the Numerical Model,” 26148, World Petroleum Conference, Stavanger, Norway, May 29-June 1, 1994.
Lake, L.W. and Jensen, J.L., “A Review of Heterogeneity Measures Used in Reservoir Characterization,” SPE-20156-MS, SPE General, Vol. 23. No. 13, 1991, pp. 409-440.
Satter, A., Ghulam, M.I., and Buchwatter, J.L., “Practical Enhanced Reservoir Engineering Assisted with Simulation Software,” PennWell Corp., Tulsa, 2008.
Shedid, S. A. and Almehaideb, R.A., “Robust Reservoir Characterization of UAE Heterogeneous Carbonate Reservoirs,” SPE-81580, SPE 13th Middle East Oil Show and Conference, Bahrain, June 9-12, 2003.
Sivila, L.J., “A Petrophysical Evaluation of Capillary Pressure for Naturally Fractured Tight Gas Sandstone (Reservoir: A Case Study),” MS thesis submitted to Colorado School of Mines (Petroleum Engineering).
Tiab, D. and Donaldson, E.C., “Petrophysics: Theory and Practice of Measuring Reservoir Rock and Fluid Transport, Second Edition,” Gulf Professional Co., London, 2004.
Timmerman, E.H., “Practical Reservoir Engineering Part-1,” PennWell Corp., Tulsa, 1982.
Torster, O., and Abtahi. M, “Experimental Reservoir Engineering Laboratory Work Book,” Department of Petroleum Engineering and Applied Geophysics, Norwegian University of Science and Technology, Trondheim, 2003.
The authors
M. G. Abd El-Nasser ([email protected]) is a reservoir engineering department head at Qarun Petroleum Co. in Egypt. He holds a BS (2006) in petroleum engineering from Al-Azhar University and is currently an MS student at Al-Azhar University. Mohamed is a member of the Egyptian Engineers Syndicate and SPE.
Dr. Sayed Gomaa ([email protected]) is an associate professor of petroleum reservoir engineering at Al-Azhar University and the British University in Egypt. He holds a BS (1999) and an MS (2005) in petroleum engineering from Al-Azhar University and a PhD (2010) in petroleum engineering from Azerbaijan State Oil Academy.
Dr. Abdel Wahab Bayoumi ([email protected]) is a professor of petroleum engineering at Al-Azhar University, Cairo. He holds a BS (1971) and an MS (1974) in petroleum engineering from Al-Azhar University and a PhD (1980) in petroleum engineering from the Oil and Gas Institute, Ploiest, Romania. He is a member of the Egyptian Engineers Syndicate and SPE.
