Cyclic gas enhances Eagle Ford oil recovery

George Grinestaff
D. Chris Barden
Jeffrey Miller
Christopher Barden
Wesley Franklin
Shale IOR LLC
Eric Ding
International Reservoir Technologies, Inc.
Implementing cyclic gas-injection enhanced oil recovery (CGEOR) throughout Eagle Ford shale’s volatile oil window can increase estimated ultimate recovery (EUR) by 30-90% depending on compressor utilization and field life, according to results of a recent study.
EOG Resources implemented CGEOR in late 2012. The technique has since expanded to more than 30 leases run by 6 Eagle Ford operators (266 wells), using produced gas for injection. Shale IOR LLC created an extensive EOR pilot- history match to understand subsequent lease EOR production and economics for two full-scale projects. Production and economics were projected up to 20 years beyond last reported production rates.
The CGEOR process is working without failure thus far, but both phase behavior and operational efficiency must be understood to achieve good economics. Eagle Ford field results show that compressor and well operations are key to production efficiency as oil production closely follows gas injection volumes.
Eagle Ford CGEOR
The primary target for produced gas injection in Eagle Ford is in the volatile oil window between 9,000-11,000 ft TVD where API gravity is greater than 40° and initial gas-oil ratio (GOR) ranges from 1,000-3,000 scf/bbl.
Shale IOR chose EOG’s Martindale pilot to history match CGEOR production using a high-resolution compositional model. It is a four-well lease in La Salle County, Tex., with no offset wells adjacent to the lease. Production began in 2012 and was on normal decline until October 2014 when the wells were shut in to install equipment required for gas injection. CGEOR started in December 2014. Initially, two large compressors were on site. One compressor was removed after initial fill-up and the pilot continued with only one compressor until injection ceased in May 2017.
All four wells on the lease had simultaneous injection and production profiles. This simplified cycle-time analysis and average well production profiles for both primary depletion and gas injection recovery.
Once calibrated, the simulation model analyzed production for all CGEOR leases in Eagle Ford. EOG’s Baker Deforest and Mitchell leases in Gonzales County were the first commercial projects and have well-established EOR declines. Simulation model yields forecast production and incremental EOR economics for a 20-year project.
Methodology
The model determines key CGEOR process drivers and obtains accurate pressure-volume-temperature (PVT) phase behavior. It predicts GOR, estimated ultimate recovery (EUR), and reservoir behavior for the compositional process.
A very fine-grid (1-ft horizontal direction away from fracture) fracture-element mechanistic model simulated one-half of a fracture, and symmetry created the full well profile. Eagle Ford rock properties and vertical reservoir description came from a type log with 7% average porosity through Upper and Lower Eagle Ford formations. The model uses dual-porosity, dual-permeability characterization with a 14-component equation of state (EOS).
Well completion, stimulated rock volume (SRV), and EUR provided the basis for scaling up the element model. Well profiles contain field pressures, rate limits, compressor limits, gas import volumes, separator efficiencies, gas recycle volumes, API oil quality, and gas quality (Btu). Injection gas composition was taken from first-stage separator gas at 1,000 psi.
CGEOR economics come from history-matching the model against base depletion for an average well at the pad. History matched model variables include geomechanics and compaction for the fracture network, discrete fracs vs. dual porosity, grid sensitivities (both 1D and 3D), and compositional dependencies. After completing base depletion match, cycle gas injections are simulated based on shut-in periods in the production data. Cumulative oil is also closely matched.
After history-matching the pilot, gas injection rates and cycles (40 days) were adjusted to maximize economic value. Economic inputs included commodity prices, tax rates, royalties, initial capital costs, and operating costs.
The Railroad Commission (RRC) of Texas supplied production data. Oil and gas production are reported at lease or pad level each month, but not water production and gas injection volumes. The latter data came from Form H-13, which an operator files within 5 years after start of production to obtain tax abatements. After CGEOR begins, the process uses more injected gas than produced, therefore reported sales gas is calculated based on initial solution GOR or a similar metric.
Martindale pilot
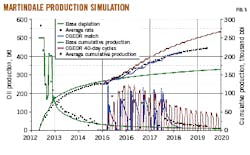
Fig. 1 shows primary and cyclic gas-injection matches for average Martindale rate and cumulative production. Field data is black, simulation depletion is green, and simulated CGEOR is blue. The simulation tool accurately predicts oil and gas composition, GOR, gas injection rate, production volumes, optimal pressures, cycle timing, and EOR recovery. From this match, cycle times of 40 days forecast pad production and generate project economics.
CGEOR production is analyzed with semi-log plots of log oil rate vs. cumulative oil (Fig. 2). The plots give direct interpretation of:
- Harmonic decline for base-depletion EUR.
- First-cycle shut-in oil rate and average shut-in well count.
- Uplift oil rate (incremental EOR).
- CGEOR decline.
- Total EUR or reserves.
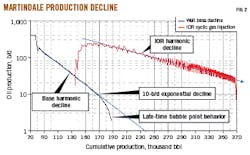
Uplift for CGEOR is often expressed as improved oil recovery (IOR) ratio, which is total EUR divided by base depletion EUR. An IOR ratio of 1.75, for example, gives an additional 75% recovery over base decline.
Decline analysis shows harmonic behavior until late life (< 10-20 b/d) at which time solution gas dominates flow below bubble- point (reduced oil mobility from two-phase flow). Martindale history match shows base depletion transitioning to exponential decline at 10 b/d. Decline from CGEOR also becomes harmonic with a smaller slope than base decline.
Martindale history’s match with consistent 40-day cycles predicts production for CGEOR. Fig. 3 shows simulations to end-2020 in brown and pilot history in blue. The model predicts IOR ratio = 1.75 after 10 years, consistent with field results showing 200 b/d per well uplift during the first cycle and decline trends suggesting an IOR ratio between 1.80 and 2.00.
Production leases
Oil and gas production forecasts came from analytical equations developed from the Martindale pilot simulation history match with 40-day cycles. The model was scaled to base depletion EUR of each lease, then it calculated EOR yield (stb/MMscf) and producing GOR as a function of cumulative gas injected. Gas injection rates were assumed to follow history and stay constant.
Economic analysis began with historical monthly production and injection data reported by RRC through June 2019. Production forecasting for base depletion used harmonic decline, forecast to 7 b/d well economic limit. Project economics were calculated on an incremental basis: total lease production less base depletion. Fluid stream economics, before tax, include:
- Cashflow including investment.
- Net present value at 10% rate (NPV10), including investment.
- Internal rate of return (IRR), the interest rate at which NPV is zero.
- Discounted return on investment (ROI), NPV10 relative to investment.
- Undiscounted ROI, cashflow relative to investment.
- Payout time, when cumulative cashflow turns positive.
Aerial surveillance of equipment on site estimated authority for expenditure (AFE). Equipment costs were estimated from compressor and equipment suppliers.
Baker Deforest
Baker Deforest was the second EOG Resources lease to begin gas injection. A total of 14 wells were drilled and estimated average base depletion EUR per well was 393,000 bbl. Fig. 4 shows first-cycle fill-up occurred March 2016, and first cycle IOR was 1,000 b/d (above baseline) for the lease, peaking at 2,000 b/d after 2-3 cycles. Initially, gas was injected at 40 MMcfd but decreased to 30 MMcfd in mid-2017 with corresponding oil-rate reduction. Fig. 4 shows the forecast base depletion and EOR. Before reduced gas injection, IOR ratio was forecast at 2.0.
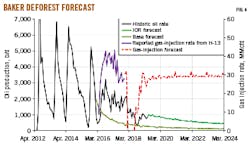
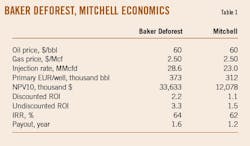
Ten-year economic analysis shows cashflow of $51.8 million, NPV10 of $33.6 million, discounted ROI of 2.2, undiscounted ROI of 3.3, IRR of 64%, and payout in 1.6 years (Table 1). Cashflow quickly turned positive but declined in 2018 when gas injection was shut in. Reduced cashflow came from cost to repressure and restart cyclic injection. The project is cashflow positive out to 10 years.
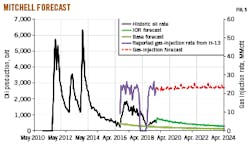
Mitchell
Mitchell lease was EOG’s third commercial IOR project. The lease was developed from 2011 through 2013 with a total of 14 wells. Fig. 5 shows that production declined to 300 b/d before gas injection. The first-cycle fill-up occurred in September 2016, and first-cycle incremental oil production was 1,400 b/d, about 200 b/d per well based on seven wells per cycle. Initially, gas was injected at about 22 MMcfd but was shut off for 6 months beginning February 2018 with a corresponding decrease in oil rate. Gas injection restarted at the previous rate, but oil rates have not returned to previous levels. Before injection shut down, IOR ratio was forecast to be 1.8, yielding an 80% increase in EUR.
Ten-year economic analysis started at the beginning of gas injection in September 2016 and used actual CGEOR production and injection volumes reported through May 2019. Forecast production after 2019 for base depletion and EOR is also shown in Fig. 5. The project had cashflow of $17 million, NPV10 of $12.1 million, discounted ROI of 1.1, undiscounted ROI of 1.5, IRR of 62%, and payout in 1.2 years (Table 1). Peak negative cash flow came from initial capital expenditure and the cost of gas needed for fill-up. Cashflow built quickly but dropped in 2018 when injection was shut down.
Sensitivity analysis performed on Baker Deforest varied the price of gas, price of oil, decline rate, and gas injection rate. Table 2 shows IRR varying from 28.2% when gas prices are high ($3.50/Mcf) and oil prices are low ($40/bbl) to 46.0% when gas prices are low ($3.00/Mcf) and oil prices are high ($50/bbl).
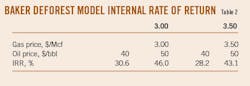
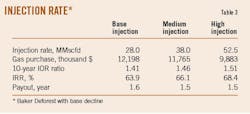
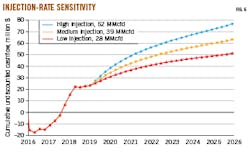
Table 3 shows that increasing injection rate from 28 MMcfd to 52.5 MMcfd improved project economics and recovery. Fig. 6 shows predictive cashflow improvement with increased rate of injection after first-quarter 2019. As injection increases, efficiency is reduced, and the process accelerates with less import gas cost. While this may not be possible with actual operations in the field, it demonstrates value for the process.
Extending CGEOR to 20 years also improves IOR ratio and net present value assuming flat commodity prices (Table 4). Even though both Mitchell and Baker Deforest had significant gas injection shut in periods in 2018, the projects can withstand start and stop periods and maintain positive cashflow. Depending upon future commodity price fluctuations, gas injection could be stopped (perhaps for gas sales) then started again to leverage gas or oil prices.

Bibliography
Grinestaff, G., Barden, C., Miller, J., Ding, E., Barden, C. W. and Franklin, W., “Evaluation of Eagle Ford Cyclic Gas Injection EOR: Field Results and Economics,” SPE-200427-MS, SPE Improved oil recovery conference IOR 2020, virtual, Aug. 31-Sept. 4, 2020.
Hoffman, B.T., “Huff-n-Puff Gas Injection Pilot Projects in the Eagle Ford,” SPE-189816-MS, Journal of Petroleum Technology, Vol. 70, No. 11, November 2018.
Orangi, A., Nagarajan, N.R., Honarpour, M.M., and Rosenzweig, J.J., “Unconventional Shale Oil and Gas-Condensate Reservoir Production, Impact of Rock, Fluid, and Hydraulic Fractures,” SPE-140536, SPE Hydraulic Fracturing Technology Conference and Exhibition, The Woodlands, Tex., Jan. 24-26, 2011.
Pearson, C.M., Griffin, L., Wright, C., and Weijers, L., “Breaking Up is Hard to Do: Creating Hydraulic Fracture Complexity in the Bakken Central Basin,” SPE-163827, SPE Hydraulic Fracturing Technology Conference and Exhibition, The Woodlands, Tex., Feb 4-6, 2013.
RS Energy Group, “EOG Resources (EOG): Shale Enhanced Recovery Is Born,” Mar. 21, 2017.
Malo, S., McNamara, J., Volkmer, N., and Amirian, E., “Eagle Ford –Introducing the Big Bad Wolf,” URTeC-2019-624-MS, Unconventional Resources Technology Conference, Denver, Colo., July 22-24, 2019.
Thomas, W.R., Helms, L.W., Driggers, T.K., Trice, D.W., and Thomas, G.L., EOG Resources (EOG) Earnings Call, May 6, 2016.
The authors
George Grinestaff ([email protected]) is CEO at Shale IOR LLC. He holds a BS in petroleum engineering (1983) from University of Wyoming. He is a member of SPE and SEG.
D. Chris Barden ([email protected]) is COO of Shale IOR LLC in Friendswood, Texas and is also an owner of Mantle Oil & Gas. He holds a BS degree in chemical engineering from Auburn University (1975) and is a registered professional engineer in Louisiana.
Jeffrey Miller ([email protected]) is a project manager and partner at Shale IOR LLC in Friendswood, Texas. He holds a BS (1979) in geological engineering from Missouri University of Science and Technology. He is a long-standing member of SPE and is a registered professional engineer in Texas.
Christopher Barden ([email protected]) is a petroleum engineer at Shale IOR LLC in Friendswood, TX. He holds a B.S. in petroleum engineering (2001) from Colorado School of Mines.
Wesley Franklin ([email protected]) is a geologist at Shale IOR LLC Friendswood, Texas. He holds a B.S. (1969) in geology from Washington State University and an MS (1975) in geology from Oregon State University. He is a member of AAPG and SPE.
Eric Ding ([email protected]) is a consulting reservoir engineer at International Reservoir Technologies, Inc., in Lakewood, CO. He holds a BS in chemical engineering (1994) from the University of Oklahoma and an MS in chemical engineering (1997) from the University of Wisconsin-Madison. He is a member of SPE and is a licensed professional engineer (petroleum) in Minnesota.