YPF method estimates tight gas reservoir pore pressure
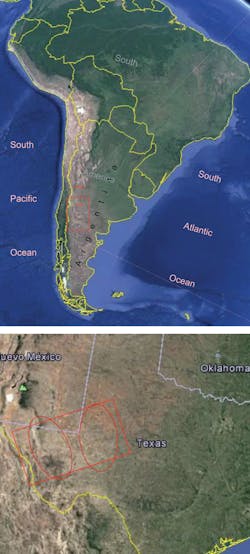
YPF SA used technology developed by Halliburton’s Landmark to build a 3D pore-pressure prediction method for a tight gas reservoir in Argentina after drilling engineers reported abnormal pore pressure distribution within a 60-sq km field. YPF plans to use its new model for future drilling in the Jurassic Lajas formation in Argentina’s Neuquen basin (Fig. 1) once natural gas prices improve. Current low gas prices have prevented any new wells from being drilled using this model.

Vaca Muerta formation—the primary focus of Argentina’s shale development and LNG export aspirations—overlays Lajas (Fig. 2). Supported by Vaca Meurta, Argentina’s production in Neuquen basin will ramp up over the next few years, with large-scale LNG production expected to begin in 2024 (OGJ Online, June 14, 2019).
As of 2016 horizontal wells targeting Neuquen’s Mulichinco formation, overlaying both Vaca Muerta and Lajas, showed the highest estimated ultimate recovery at more than 5 bcf. Representative wells in the Lajas formation, meanwhile, were expected to recover a third of that.
YPF has partnered with Equinor, Chevron, ExxonMobil, BP, Total SA, and Shell among others, to develop Argentina’s resources, but retains a leadership role in the process. The company’s 2017 annual report said that 42% of the roughly 15,000 wells in Argentina in which it has an interest were in Neuquen basin. ExxonMobil, by contrast, holds interests in about 900,000 net acres in Vaca Muerta, but has drilled seven wells.
Argentina became a net natural gas importer in 2008 and imports natural gas by both pipeline and as LNG throughout the year. In the last 2 years, however, with growth in domestic production, Argentina has been importing LNG only during cooler months.
Accurate pore pressure prediction is key to safe drilling and to make a production forecast model, said Mailen Fontana, a geoscience technical consultant with Halliburton. “The geophysicists will try to enhance the model resolution through use of velocities derived from elastic inversion instead of seismic processing,” she told the Landmark Innovation Forum & Expo.
Understanding elastic inversion requires thinking of seismic waves as two types: P-waves (primary, because they are faster) and S-waves (secondary, since they are slower). Both types are in seismic and wells but at different scales. Well data show the properties of the rock´s layer while seismic data show information about the boundary between rock layers.
The rocks have different densities that cause the seismic reflection. When a wave encounters material properties (density) its energy is split into reflected and refracted waves. Inversion replaces the seismic signature with a blocky response corresponding to elastic impedance layering. The impedance is the product of rock density and wave velocity. It facilitates the interpretation of geological and petrophysical boundaries in the subsurface. Through elastic inversion, geophysicists can calculate a more accurate velocity model by combining data coming from seismic and wells.
Geopressure analysis
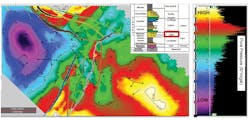
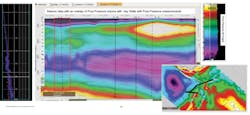
Landmark’s DecisionSpace provided geopressure analysis tools to compute volumes of density, vertical-effective stress, and pore-pressure gradient from velocity volumes (Fig. 3). These results were compared with measurements from wells (Fig. 4).
Lajas formation has a permeability between 0.000-0.1 md and 5-9% porosity. Average depth was 9,800 ft. Fluvial sandstones are interbedded with shales estimated to be 200-250 m thick. A velocity model was built using intervals from seismic processing and a structural framework. Engineers calculated 3D volumes for density, overburden, pore pressure, and fracture gradient.
Faults influenced the pore-pressure distribution. Engineers used cross sections to overlay their 3D-pore pressure-gradient model with information available from 8-10 wells out of 25 wells in the field.
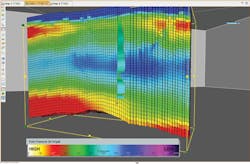
Pore-pressure gradient data were blocked in a 3D grid using Landmark’s earth modeling tool (Fig. 5). Engineers superimposed a well on the geocellular grid showing pore pressure values distributed along each cell.
“This method of pore-pressure prediction focuses on knowing the geological setting and compartmentalization instead of the premise that pore pressure affects the compaction-dependent geophysical properties,” Fontana said.
YPF built a 3D depth hybrid velocity model using horizons, faults, well picks, and interval prestack depth migration (PSDM) velocities inside a structural framework, which “led to a robust comprehension of the pore pressure signature at the Punta Rosada formation.”
Drillers used dynamic frameworks to build a velocity model that captures the structure of the area. Then the hybrid velocity model was used as input in the geopressure analysis tool to calculate density, overburden gradient, pore pressure, and fracture gradient volumes. Finally, the volumes were blocked using the earth modeling tool, along with the 1D data from each well as provided by the geomechanics team.
“New models and attribute extraction at the horizons of interest show that pore pressure is driven, primarily, by structural patterns: the key faults. In addition, their effect on subsurface pressure uncertainty causes recurrent challenges in reaching objective targets,” she said.
Velocity reversal can also indicate high overpressure or a zone in which the velocities all drop below the top of the Vaca Muerta formation, the Upper Punta Rosada.
“After analyzing the pore pressure behavior obtained from the calculations, we can find a strong relationship between the geological structure of the study area and the pore pressure distribution,” Fontana said.
About the Author

Paula Dittrick
Senior Staff Writer
Paula Dittrick has covered oil and gas from Houston for more than 20 years. Starting in May 2007, she developed a health, safety, and environment beat for Oil & Gas Journal. Dittrick is familiar with the industry’s financial aspects. She also monitors issues associated with carbon sequestration and renewable energy.
Dittrick joined OGJ in February 2001. Previously, she worked for Dow Jones and United Press International. She began writing about oil and gas as UPI’s West Texas bureau chief during the 1980s. She earned a Bachelor’s of Science degree in journalism from the University of Nebraska in 1974.