Blue hydrogen energy transition requires hydrocarbons, carbon storage
Michelle Pittenger
GHD Group Pty. Ltd.
Houston
The oil and gas industry can participate in the hydrogen industry by supplying fossil fuels for hydrogen production and sequestering waste CO2 in deep saline aquifers or depleted gas reservoirs in a process referred to as blue hydrogen. Currently, almost 80% of hydrogen production is not clean, most of it occurring through natural gas reforming or coal gasification, with CO2 emissions released to the atmosphere.1
The industry’s extensive worldwide geological knowledge of depleted oil and gas fields will provide some of the most effective places to store CO2. Subsurface modeling, surface facilities and well construction, and plume monitoring require similar disciplines to petroleum exploration or development. Oil and gas professionals therefore can make significant contributions towards the energy transition.
Clean hydrogen
Clean hydrogen, produced from renewables, nuclear, or fossil fuels with carbon capture utilization and storage (CCUS), helps decarbonize industry sectors in which it’s difficult to reduce emissions. Industries like iron and steel, long-haul transportation, and chemicals will greatly benefit from a clean hydrogen fuel source to reduce CO2 emissions. Additionally, clean hydrogen can produce electricity and can be stored long-term, unlike most other renewable resources.
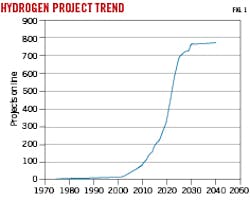
The 2021 International Energy Agency’s (IEA) hydrogen projects database records almost 1,000 projects worldwide that have been commissioned since the year 2000 to produce hydrogen for energy or climate change mitigation purposes.2 Of these projects, 85 are scheduled to come online in 2022 alone. Fig. 1 shows the IEA database cumulative number of online hydrogen projects by year since 1975. This figure excludes more than 200 projects in concept or feasibility phases which do not yet have an expected online date. Though Germany and Spain have the highest number of projects, the US rates third with 81.
In its net-zero emissions scenario, IEA expects that clean hydrogen can contribute up to 6% of the total cumulative 2021-50 emissions reductions. In North America, the US Hydrogen Road Map, produced by a coalition of leading energy, transportation, fuel cell manufacturing, and electric power companies, presents a plan for the hydrogen industry to meet 14% of US energy demand by 2050.3 The province of Alberta, Canada, has its own roadmap and expects to be a global supplier-of-choice in clean hydrogen exports by 2030.4
Other countries, including Australia, have also developed hydrogen roadmaps. In China, 16 provinces and cities have developed 5-year plans specifically featuring hydrogen, while the national hydrogen strategy is still under development. The key to these global efforts is making not just hydrogen, but clean hydrogen.
CCUS near-term decarbonization
There are two primary options for making clean hydrogen: water electrolysis (green hydrogen) or fossil fuels with CCUS (blue hydrogen). Electrolysis uses water and electricity from renewables or nuclear to produce hydrogen. About 9 l. of potable water are required to produce 1 kg H2 with an estimated cost of $3-8/kg H2.
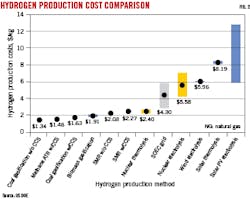
Blue hydrogen can be produced from fossil fuels using steam methane reforming (SMR), autothermal reforming of methane (ATR), or coal gasification (CG). Blue hydrogen requires capturing and removing CO2 emissions through either underground storage or utilization during the natural gas reforming or coal gasification process. Estimated production costs using these processes is $1-3/kg H2.5 The amount of water required for natural gas reforming is similar to electrolysis, while coal gasification uses slightly less water (6 l./kg H2). Fig. 2 compares hydrogen production costs by technology as presented by the US Department of Energy (US DOE).6
In addition to the higher cost required to produce green hydrogen, the limited amount of available renewable power provides another reason to move forward with blue hydrogen. About 55 Mw-hr of power is required to generate 1 tonne of hydrogen by electrolysis, regardless of the power source. A coal power plant releases about 56 tonnes of CO2 to generate 55 Mw-hr, and a natural gas power plant releases about 23 tonnes CO2 to generate 55 Mw-hr. One ton of hydrogen produced from SMR, by contrast, releases about 10 - 12 tonnes of CO2. A better usage of limited renewable power, therefore, is to displace burning of coal or natural gas in power generation, rather than using it to make green hydrogen.
Today, more than 95% of hydrogen production is from SMR or CG, but only 1% of that production includes CCUS.7 Depending on process efficiency and type of fuel used to generate the steam, SMR CO2 capture rate ranges from 55-90% and coal gasification capture rate is 85-90%. SMR produces about 10 kgCO2/kgH2, while CG produces nearly double that amount, requiring a significant amount of CO2 capture and storage to produce blue hydrogen. Blue hydrogen can offer an opportunity for near-term decarbonization, but only when enabled by CCUS technology.
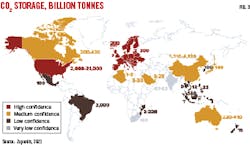
Still to be determined is whether there will be sufficient storage capacity to contain associated CO2 produced from blue hydrogen, given that global hydrogen demand is expected to reach 200 million tonnes by 2030. Researchers have been studying the subsurface worldwide to understand the potential for CO2 storage. The Global CCS Institute has compiled these studies to produce a map, by country, of estimated CO2 geological storage capacity (Fig. 3). Confidence is defined as a measure of the maturity of the storage resource appraisal. The Institute concluded that storage capacity is more than sufficient for all CCS applications, but the opportunity will be in identifying storage locations which also match up with blue hydrogen production sites.
CO2 storage in oil, gas fields
Storage reservoirs need appropriate porosity and permeability to inject and permanently trap CO2. Additionally, reservoirs need to be deep enough to keep CO2 in a supercritical phase, where it expands like a gas but has liquid-like density with low viscosity. This phase occurs above 7.4 megaPascal (MPa) and 31.1° C. Types of formations that have these properties include depleted oil and gas reservoirs, deep coal seams, unconventional shale reservoirs, deep saline aquifers, and potentially basalts.
Saline aquifers are the best storage options for CO2, but the abundance of depleted fields provide large volumes and opportunities for CO2 storage. US DOE’s National Energy Technology Laboratory (NETL) estimates storage capacity in North American oil and gas reservoirs of 186-232 billion tonnes.8 Mature oil and gas fields, however, contain existing well penetrations which potentially provide conduits for CO2 leakage. Also, production may have reduced pressure below that required to maintain CO2 in a supercritical state.
Deep coal seams and unconventional organic shales could be used for CO2 storage, with the added benefit that CO2 molecules can adsorb onto coal or shale minerals, which then releases associated methane. This methane production provides an additional source of revenue for CO2 storage projects, and adsorption assures permanent trapping of CO2. On the downside, permeability in these formations may be insufficient for injection. Hydraulic fracturing could be required, increasing injection costs and potential for CO2 leakage from the intended reservoir.
Deep saline aquifers are estimated to have the largest available capacity for carbon storage, with 2-20 trillion tonnes estimated by NETL for North America alone. Unfortunately, because these formations are deep and less prospective for petroleum exploration, there is little data available to evaluate them. Additionally, most of these reservoirs lack a traditional structural or stratigraphic trap to contain CO2. This means that other trapping mechanisms must be relied upon, such as solubility, residual, and mineral trapping.
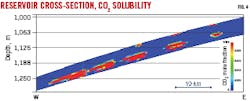
Solubility trapping occurs as CO2 dissolves in saline water (brine) and the density of that brine increases. As the denser CO2-saturated brine sinks in the reservoir, unsaturated brine moves up in the reservoir to allow more CO2 to dissolve in the brine. The amount of CO2 that can be dissolved is dependent on the pressure, temperature, and salinity of the brine.
Fig. 4 shows a representative cross-section through a simple CO2 injection reservoir simulation model, in which the color scale represents CO2 mole fraction in brine after 30 years of CO2 injection into a saline reservoir. Although injection occurs at the top of the reservoir, most of the denser CO2-saturated brine sinks to the base of the reservoir, permanently trapping CO2.
Residual trapping, also known as capillary trapping, occurs after CO2 injection stops and brine begins imbibing back into the formation; small pockets of CO2 are permanently trapped in pore spaces within the formation. Mineral trapping takes place when CO2 dissolved in brine reacts with surrounding minerals in the formation to form new carbonate minerals. This is generally a slow process, requiring thousands of years, and does not significantly contribute to CO2 trapping, though the reaction rate is greatly increased in basalts. The Carbfix project in Hellisheidi, Iceland, in operation since 2014, demonstrated that CO2 injected into fractured basalts will form carbonate minerals in just 4-9 months.9
Significant amounts of calcium, magnesium, and iron in basalt (up to 25%), combined with elevated temperatures, contribute to this high reaction rate. In the Carbfix project, CO2 and H2S dissolved in water were injected into basalts at 750 m depth and 250° C. Injection volumes have been small, with 23,300 tonnes CO2 and 11,800 tonnes H2S injected in the first 3 years, but the injectivity has remained stable and unaffected by mineralization. The IEA Greenhouse Gas research and development program (IEAGHG) has identified potential areas for CO2 storage in basalts around the world (brown areas in Fig. 5).10

Subsurface modeling
One of the key components of a successful CO2 storage project is a subsurface model. Modeling enables selection and evaluation of the storage system, planning of exploration and appraisal wells, assessment of subsurface risks and uncertainties, optimization of development, and CO2 monitoring both during and after injection. The subsurface model starts with geologic evaluation of the reservoir, underlying and overlying seals, and development of a static geomodel. Petrophysical evaluation contributes to the population of reservoir and seal properties within the geomodel.
Reservoir engineers use this model to simulate injection and predict the fate of CO2 from the start of injection to thousands of years in the future. Well and production engineers can then design required injection and monitoring wells to develop the storage reservoir. As new subsurface data are acquired, the process iterates to incorporate new data and update modeling, much like traditional oil and gas developments.
MMV
Measurement, monitoring, and verification (MMV) are especially important aspects of any CCUS project. The subsurface model predicts and monitors CO2 movement through the reservoir and designs an injection plan to avoid potential CO2 leakage. MMV is often the most public part of the CCUS project, so it must assure that CO2 is being safely and permanently stored in the subsurface. This requires monitoring in the geosphere (deep subsurface, including the storage formation), hydrosphere (shallow subsurface containing potable water resources), biosphere (biological portion of the surface), and atmosphere. Some monitoring techniques, like 4D seismic and distributed acoustic-temperature sensing, are familiar to the oil and gas industry. Other techniques, like interferometric synthetic aperture radar (InSAR) or laser CO2 monitoring, are currently outside normal oil and gas operations.
The author
Michelle Pittenger ([email protected]) is lead geologist CCUS at GHD, Houston, Tex. She has also served as staff geologist at ConocoPhillips Co. She holds an MS (1991) from University of Texas at El Paso. She is a member of the American Association of Petroleum Geologists, Association for Women Geoscientists, and Houston Geological Society.
References
- IEA, Hydrogen, Paris, 2021.
- IEA, Hydrogen Projects Database, 2021.
- Fuel Cell and Hydrogen Energy Association (FCHEA), “Roadmap to a US Hydrogen Economy,” 2020.
- Alberta Hydrogen Roadmap, Ministry of Energy, 2021.
- IEA, “Global average levelised cost of hydrogen production by energy source and technology, 2019 and 2050,” CCUS in Clean Energy Transitions, 2020.
- USDOE, 2020, “Hydrogen Strategy, Enabling a Low-Carbon Economy,” Office of Fossil Energy, US Dept. of Energy, Washington, DC, 2020.
- Zapantis, A., “Blue Hydrogen,” Global CCS Institute, April 2021.
- National Energy Technology Laboratory (NETL), Carbon Storage Atlas, 5th Ed., 2015.
- Clark, D., Oelkers, E.H., Gunnarsson, I, Sigfusson, B., Snaebjornsdottir, S.O., Aradottir, E.S., Gislason, S.R., “CarbFix2: CO2 and H2S mineralization during 3.5 years of continuous injection into basaltic rocks at more than 250o C,” Geochimica et Cosmochemica Acta, Vol. 279, June 15, 2020, p. 45-66.
- IEA Environmental Projects Ltd, (IEAGHG), “Geological Storage of CO2 in Basalts,” Report 2011/TR2, September 2011.