Correcting rated pump performance improves heavy oil pipeline efficiency
Yang Yu
Changchun Wu
Xiaokai Xing
China University of Petroleum
Beijing
Yangchen Shi
Sinopec Pipeline Storage &
Transportation (Branch) Co.
Weifang, China
Yanping Li
Lili Zuo
China University of Petroleum
Beijing
Correcting rated pump performance to working conditions in the field will increase efficiency, particularly when the pipeline is transporting heavy oil. This article presents a model for correcting pump performance guidelines for heavy oil pipelines.
Corrected head (efficiency) points are closer to the Donglin pipeline's actual in-service points than the uncorrected points, illustrating the model's feasibility and providing a simple, relatively high accuracy tool for application to heavy oil pipeline engineering in general.
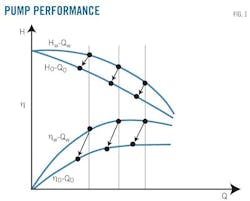
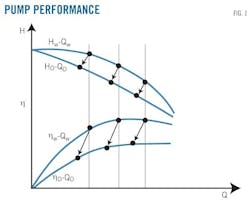
Standard centrifugal pump characteristics apply to media having a kinematic viscosity close to water at 20° C. (~1 cSt), the conditions under which they're typically tested. For heavy oil pipelines, however, the viscosity of the oil exceeds 20 sq mm/sec. Head (H) and flow rates (Q) decrease slightly, and efficiency (η) drops sharply when kinematic viscosity exceeds 20 sq mm/sec (Fig. 1).1 Pump performance should be corrected accordingly.
In the 2000s, the American Hydraulic Institute (AHI) put advanced a model to correct pump performance based on test parameters of flow rate (QBEP) at best efficiency point (BEP) with water of 3-410 cu m/hr; and a stage head (HBEP) at BEP measuring 130 m.2 QBEP and HBEP of pumps used in many long-distance pipelines, however, will mostly exceed 410 cu m/hr and 130 m, respectively,3 reducing the formula's accuracy and calling for a new correcting method for heavy oil pipelines. This article will use pump operating parameters from a Chinese heavy oil line to build that model.
Correcting model
Flow complexity around the impeller poses many fluid dynamic problems that cannot be solved by mathematical analysis,4 5 requiring experiments instead to find its regular pattern. Accuracy of the empirical model relies largely on the reasonable combination of the parameters involved in the phenomenon.
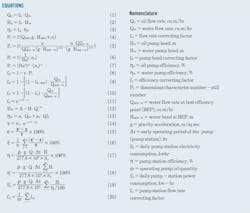
The dimensionless characteristic number, Pv, represents the degree of similarity among different pumps transporting different viscous heavy oil. Pv allows determination of the correcting factors formula of flow rate (fQ), head (fH), and efficiency (fη). The pumps' corrected flow rate (QO), head (HO), and efficiency (ηO) emerges by multiplying the corresponding correcting factor by performance on water (QW, HW and ηW), expressed by Equations 1-3, respectively (see accompanying equations box.) Deducing the analytic expression of Pv and correcting factor formulas calls for repeated trials to determine related parameters in each correcting factor.
The pump's performance changes when it pumps viscous liquid, especially heavy oil. Five main physical quantities, such as head on water (HBEP-W), flow rate on water (QBEP-W), the kinematic viscosity of the heavy oil (ν), the speed of the pump (n), and the acceleration of gravity (g) serve as main influence factors. Table 1 shows the physical units and corresponding dimensions for these five main quantities. Equation 4 can define all these physical quantities and Pv.
Applying Buckingham π theorem,6 a key theorem in dimensional analysis, allows further derivation of Equation 4. Equation 4's use of five physical variables, and their dimensional matrix rank of 2, makes it equivalent to an equation involving a set of two dimensionless parameters built from the original variables (Equation 5).
The first item on the right side of Equation 5 is a modified Reynolds number (Re') and the second item represents the specific speed of the pump (ns), allowing Equation 5 to be rearranged as Equation 6. Once the type of pump is determined, Re' reflects the effects on Pv caused by the viscosity of the heavy oil, and ns reflects the effects on Pv caused by pump type. Acquiring the analytic expression of Pv requires introducing the parameters p and q to change Equation 6 into Equation 7. Repeated trial based on experiment data can determine the values of p and q.
The degree of similarity among different pumps transporting different viscous heavy oils appears in three aspects—flow rate, head, and efficiency—represented by fQ, fH, and fη, respectively. If the viscosity of heavy oil is close to that of water, fQ, fH, and fη approach 1. And if the viscosity of heavy oil is higher than that of water, fQ, fH, and fη approach 0. It is assumed that the pump performance at dead point, where flow rate is 0, will not change when pumping heavy oil.
As the flow rate of the pumping liquid decreases slightly with the rise of viscosity and fQ depends on the ratio between flow rate at BEP on heavy oil (QBEP-O) and the QBEP-W, fQ calculating can be defined by Equation 8, the value of r in which can be determined by repeated trials.
The actual pump head at dead point is equal to that of the water, and the decreased pump head on heavy oil relates to the flow rate, allowing Equation 9 to define the form of fH calculating formula.
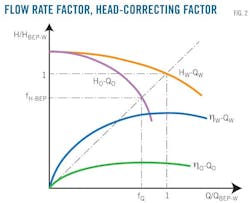
The fH-BEP involved equals fQ (Fig. 2), transforming Equation 9 into Equation 10. Moreover, pump efficiency decreases greatly with rising viscosity, allowing Equation 11 to define the calculating formula of fη. Experiment data determine the value of t involved in Equation 11.
Determining the value of model variables p, q, r, s, and t uses test data with a flow rate range of 1,000-2,200 cu m/hr and a head range of 100-300 m. Parameter determination calls for repeated trials to make the model more precise. Table 2 lists parameter values.
Correction procedure
Once the pump characteristic curves for water are known and the kinematic viscosity of a liquid given, these four steps determine model performance for heavy oil:
• Using Equation 7, calculate Pv based on the parameters at BEP with water.
• Using Equation 8, calculate fQ; and using Equation 1, correct QW to QO.
• Using Equation 10, calculate fH; and using Equation 2, correct HW to HO.
• Using Equation 11, calculate fη; and using Equation 3, correct ηW to ηO.
Field test
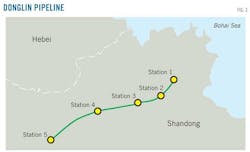
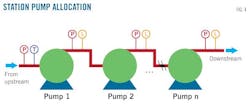
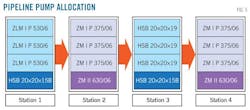
Donglin Pipeline's pumps provided the setting for field tests. Donglin transports heavy oil from Shengli oil field to eastern China and includes five pump stations (Fig. 3). Each pump station except Station 5 has four serial pumps (Fig. 4), three of which are of the same type and have a relatively high head compared to the fourth (Fig. 5). All of the pumps run at a constant speed. Table 3 outlines relevant parameters, such as type, parameters at BEP, and pump speed.
Given the curve graph of pump characteristics on water at 20° C., the head vs.flow rate relationship and efficiency vs. flow rate characteristic equation take the form of Equation 12 and 13, respectively. Note that A, B, a1, and a2 are undetermined coefficients, with fitting results presented in Table 4.
Sampling of heavy oil transported in the Donglin Pipeline occurred Feb. 11, May 10, Aug. 9, and Nov. 21, 2012. Physical property tests, aimed at measuring heavy oil density, used a petroleum gravimeter and measuring cylinder. Table 5 shows density test results.
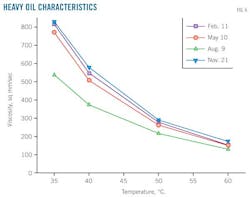
Rheological property tests, aimed at obtaining the oil's viscosity-temperature characteristics, used a thermostatic water-bath and rotary rheometer. Fig. 6 shows the viscosity-temperature characteristics test results for the heavy oil. Equation 14 shows the relationship between viscosity and temperature. Table 6 lists ν0, u, and T0 parameters and results.
The pipeline's supervisory control and data acquisition system (SCADA) collected daily operation reports containing throughput per pump station, power consumption per pump station, gathering pipe inlet pressure per station, and outlet pressure per pump, among other variables, from Jan. 1 to Dec. 31, 2012. Statistical analysis of these data abandoned any outliers.
Characteristic correction, evaluation
Evaluation of correcting-model precision used relative-error analysis towards corrected value, uncorrected value, and actual measured value. The actual measured value is derived from the operating parameters of the pipeline, and corrected and uncorrected performance refer to the correcting model calculated and the value acquired by the pump characteristic equations on water, respectively.
For each daily report, a bonding of average flow rate per hour (Q) and average pump head (H) is regarded as an actual condition point (Q, H). Similarly, a bonding of flow rate (QW) and pump head (HW) on water is defined as an uncorrected condition point (QW, HW). And a bonding of a corrected flow rate (QO) and corrected pump head (HO) on heavy oil is defined as a corrected condition point (QO, HO).
Calculating a group of condition points (an uncorrected point, a corrected point, and an actual point) uses the following steps:
• Calculate the actual point (Q, H) by referring to the daily reports.
• Calculate the viscosity of the heavy oil (v) using the temperature of the oil at the outlet of the pump station and Equation 14.
• Calculate Pv, fQ, and fH. Table 3 provides parameters at BEP and pump speed. Pv, fQ, and fH can be calculated by Equations 7, 8, and 10, respectively.
• Calculate (QW, HW). Assuming QO=Q, Equation 1 can solve QW, and HW can be obtained by plugging QW into Equation 12.
• Calculate (QO, HO), assuming QO=Q and HO can be calculated by plugging fH and HW into Equation 2.
• Perform quantitative analysis by analyzing relative error and average relative error between the uncorrected value (corrected value) and actual value using Equations 15 and 16, respectively.
For each daily report, a bonding of average flow rate per hour (Q) and average pump efficiency (η), which can be calculated by Equation 17, serves as the actual operating condition point (Q, η). The uncorrected condition (QW, ηW) consists of the flow rate (QW) and pump efficiency (ηW) on water; the corrected condition point (QO, ηO) consists of the flow rate on heavy oil (QO) and its corresponding pump efficiency (ηO).
Specific evaluation uses the following steps:
• Calculate actual condition point (Q, η), referring to the daily reports and using Equation 17.
• Calculate the viscosity of the heavy oil (v) using Equation 14.
• Calculate Pv, fQ, and fη, using the BEP and the pump speed parameter in Table 3 and Equations 7, 8, and 11, respectively.
• Calculate the point (QW, ηW). Assuming QO= to Q, Equation 1 can determine QW, and ηW can be obtained by plugging QW into Equation 13.
• Calculate the point (QO, ηO), with QO=Q, and HO computed by plugging fη and ηW into Equation 3.
• Quantitative analysis is similar to that used earlier to evaluate H-Q. These steps only apply when individual pump power consumption can be measured or there is only a single operating pump for each station. In other circumstances, indirect evaluation using a virtual physical quantity (efficiency of pump station), regarding all station operating pumps as a whole and reckoning a comprehensive index of the combined efficiency of all operating pumps.
Pump station efficiency can be calculated with Equation 18, in which S'p stands for daily pump station power consumption (Equation 19). The average fQ of all operating pumps in the pump station determines f"O for the pump station as a whole and can be expressed by Equation 20.
Results, analysis
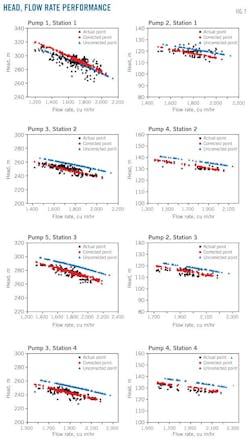
The collected and analyzed operating parameters of the Donglin pipeline allowed analysis and correction of its pumps' performance based on the particular heavy oil being transported. Fig. 7 and Table 7 show the H-Q relationship of the actual, uncorrected, and corrected condition points, the number of condition points, the relative error range, the average relative error, and the kinematic viscosity range of the heavy oil.
It shows that:
• After correction, average relative errors show a slight decline, and the median value of the relative error range moves closer to zero.
• After correction, the maximum average relative error declines to 1.5% from 4.3%, for Pump 4 in Station 4.
• Correction makes calculation of head characteristics more precise.
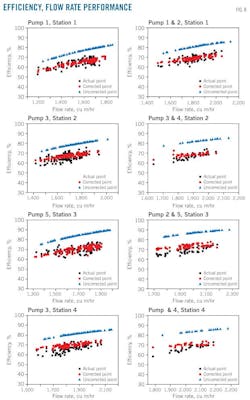
Fig. 8 and Table 8 illustrate the relationship diagram for η-Q characteristic of the actual, uncorrected, and corrected condition points, number of condition points, relative error range, average relative error, and kinematic viscosity range of the heavy oil, showing that:
• After correction, average relative errors show a marked decline and the median value of the relative error range moves closer to zero.
• After correction, the maximum average relative error declines to 5.3% from 25.3%, for Pumps 3 and 4 at Station 4.
• The change of efficiency characteristic is more sensitive to increased viscosity, potentially making calculated efficiency more precise meeting general engineering requirements.
Acknowledgement
The authors thank Sinopec Pipeline Storage & Transportation (Branch) Co. for providing relevant pump characteristic parameters on water and daily operation reports.
References
1. Qian, X.J., and Chen, H., Pump and Compressor, China University of Petroleum Press, Dongying, 2007.
2. Hydraulic Institute, Effects of Liquid Viscosity on Rotodynamic (Centrifugal and Vertical) Pump Performance, ANSI/HI 9.6.7-2010, Parsippany NJ, 2010.
3. Dai, J.Q., and Ye, D.F., World Pipelines Handbook, Petroleum Industry Press, Beijing, 2003.
4. Cheng, X.D., Rotodynamic pump, ventilator and compressor: Theory, design, operation and strength, China Machine Press, Beijing, 2011.
5. Yuan, E.X., Engineering Fluid Mechanics, Petroleum Industry Press, Beijing, 1986.
6. Howison, S., Practical Applied Mathematics: Modeling, Analysis, Approximation, Cambridge University Press, Cambridge, 2005.
The authors
Yang Yu ([email protected]) is a PhD candidate at China University of Petroleum, Beijing. He obtained his MS (2013) in oil and gas storage and transportation from China University of Petroleum, Beijing. He is a student member of American Society of Mechanical Engineers, Chinese Mechanical Engineering Society, and Operations Research Society of China.
Changchun Wu ([email protected]) is a professor at China University of Petroleum, Beijing. He has also served as professor assistant, lecturer, and associate professor at the university since 1985. He holds an MS (1985) in oil and gas pipeline engineering from Beijing graduate school of East-China Petroleum Institute. He is a member of Chinese Petroleum Society.
Xiaokai Xing ([email protected]) is an associate professor at China University of Petroleum, Beijing. He has served as associate professor at University of Petroleum China, East-China. He holds a PhD (2005) from Beijing University of Technology.
Yangchen Shi ([email protected]) is an assistant engineer at Weifang Oil Transportation Department, Sinopec Pipeline Storage & Transportation (Branch) Co., Weifang. He holds a BS (2010) in oil and gas storage and transportation from Liaoning Shihua University.
Yanping Li ([email protected]) is a graduate student at China University of Petroleum, Beijing. He obtained his BS (2012) in oil and gas storage and transportation from China University of Petroleum, East-China.
Lili Zuo ([email protected]) is a lecturer at China University of Petroleum, Beijing. She holds a PhD (2008) in oil and gas storage and transportation engineering from China University of Petroleum, Beijing.
