MODELING GULF OF MEXICO LOST PRODUCTION—3: Value of production losses tallied for 2004-05 storms
In extreme weather, damage to offshore facilities is unavoidable and can take many forms. To better understand the scope of weather risk and catastrophic loss in the Gulf of Mexico, and the factors that impact the redevelopment decisions of operators, we quantify the value of lost production associated with the 2004-05 hurricane seasons under various price and model scenarios. We estimate that the value of lost production from the 2004-2005 hurricane seasons range between $1.3 billion to $4.5 billion, depending upon the scenario assumptions employed. For a future average oil and gas price of $100/bbl and $10/Mcf, the total lost production is estimated to be $3.7 billion. We perform sensitivity analysis, describe the maximum redevelopment cost per structure that will yield a specific rate of return, and discuss the limitations of modeling.
Value of lost production
The decision to repair, replace, or abandon damaged and destroyed infrastructure is determined by several factors. The return on investment that an owner would expect to receive depends upon the cost to fabricate/install a new platform, subsea assembly and/or pipeline interconnection/tieback, as well as the cost of removing/repairing the destroyed/damaged structure, plug and abandonment cost, and the cost to renter/redrill wells. All of these costs are weighed against the potential revenue expressed through the remaining reserves, expected future prices, operating cost and strategic considerations. If the estimated value of future production is less than the expected cleanup and redevelopment cost, then the decision to redevelop the field will either be postponed or not undertaken.
The timetable for decommissioning depends on whether the lease is on production. If the structure is on a producing lease, owners have greater flexibility on scheduling cleanup and decommissioning activities. If the structure is not on a producing leasehold, decommissioning must be completed within one year after production stops or the owners must find an interested buyer for the property.
We do not attempt to estimate clean-up and redevelopment cost for the hurricane destroyed structures, since these are site-specific, require specialized knowledge to perform, and are subject to significant uncertainty. Instead, we focus on the potential value of the lost production, since this is more accessible and can be estimated with reasonable certainty. Estimating the value of lost production provides an upper bound for the amount of money an owner would be willing to spend to redevelop an asset on a stand-alone basis.
Lost production and valuation
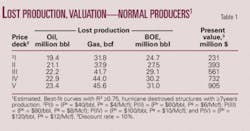
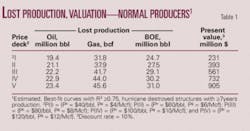
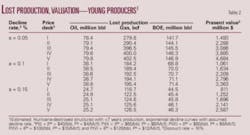
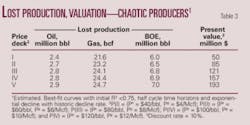
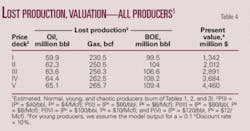
For each destroyed structure, we forecast future production and abandonment according to the model specification described in Part 2. Production is valued at a constant oil and gas price across the life cycle of each asset under five scenarios. We break out the production forecast and valuation for structures that yielded an acceptable initial model fitnormal producers (Table 1); structures with less than 7 years production historyyoung producers (Table 2); and structures that required additional processing to yield an acceptable decline modelchaotic producers (Table 3). Model results for all three categories are subject to uncertainty, but the later two asset classesand especially young producersare considerably more uncertain than normal producers. The aggregate forecast and valuation is summarized in Table 4.
For the normal producer class, the amount of lost production is reasonably sensitive to the price deck (Table 1), while for the early and chaotic producers, the variation in production output is less sensitive (Tables 2, 3). The likely explanation for this is due to the nature of the models employed in Table 1 (which includes exponential, harmonic, and hyperbolic curves), relative to the assumed (exponential) decline forms employed in Tables 2 and 3. Most of the value of future production is contained with the early producers, both by virtue of their higher production rates and longer anticipated production cycles. It is interesting to note that across all producing structures, the amount of lost production is only slightly sensitive to the price deck, while the valuation estimates are highly sensitive. This is primarily due to the mature nature of the producing propertiesa high price deck may delay the economic limit, but does not play a significant role in contributing to additional quantities of production because of the high fixed cost associated with offshore operations. In Table 2, as decline rates increase, production drops more quickly, decreasing the reserves estimates.
null
Rate of return calculation
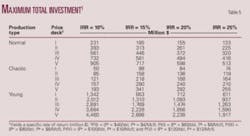
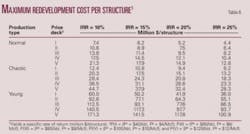
The aggregate present value of each structure’s cash flow stream for each price deck is shown in Table 5 under variable discount rates, extending the valuation estimates provided in Tables 1-4. The values represent the maximum capital investment in total that owners would be able to spend to provide a specified return. For a given price deck, as the rate of return increases, the allowable capital expenditures will necessarily decrease. As the price deck increases, the revenue from production will increase, and with it the total expenditures that can be spent to achieve a given return. Thus, as we proceed down a given column, the maximum allowed investments increase, and as we proceed across a given row, the maximum allowable investment decreases. The redevelopment cost per structure that yields a specific rate of return is shown in Table 6.
null
null
Average redevelopment costs
Average redevelopment costs provide insight into the cost equation facing operators. Consider an operator with price deck P(III) = {Po = $80/bbl, Pg = $8/Mcf} and a desired IRR of 15%. An “average” gulf operator could spend $11.4-24.3 million to achieve a 15% return, while an operator with a young producer could spend as much as $93.1 million on redevelopment and cleanup. An operator that required a 25% return would have a more constrained capital budget, ranging from $8.2-18.3 million (for normal/chaotic producers) to $66.5 million (for young producers). Structures early in their production cycle, by virtue of their reserves potential and expected number of years of remaining production, can spend significantly more capital for redevelopment. The results in Table 6 represent average cost but can, of course, be specialized to individual assets.
null
Sensitivity analysis
There are many uncertain factors in production and valuation estimation that are not directly amenable to analysis. Commodity price level was considered explicitly by using price deck scenarios, and for early producers, we illustrated the impact of changes in the assumed decline rate (Table 2). Additional parameters that impact the cumulative production and valuation estimate is the threshold used to determine when production will no longer be commercial and the discount factor used in the cash flow analysis. We vary the economic limit and the discount rate across all structures to determine the degree to which changes in these factors impact the model output.
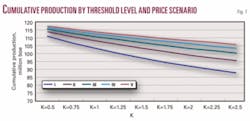
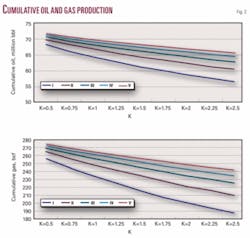
The change in cumulative oil, gas, and barrels of oil equivalent production across five price scenarios as a function of changes in the threshold level are depicted in Figs. 1 and 2. In these illustrations, the economic limit τa(s) is multiplied by the factor k, k ≥0, and as the value of k increases, k·τa will increase, causing the economic limit to occur at an earlier time, reducing cumulative production and valuation estimates. The greatest change in cumulative production occurs at low price decks.
null
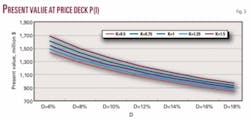
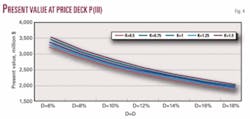
The sensitivity of the present value to changes in the discount rate is shown in Fig. 3 for the price deck P(I) and in Fig. 4 for the price deck P(III). As k and D increase, present value decreases. Similar figures can be broken out for each price deck and producer class category.
Next week: The authors describe the use of a more sophisticated, and in many respects, more useful technique to explore sensitivity analysis and the complex interactions of assumptions on model output.
