China tight reservoirs perform better over time through MSF
Xiuyu Wang
Shenglai Yang
Yu Pu
China University of Petroleum
Beijing
Feng Zhou
Sinopec Southwest Oil & Gas Co.
Chengdu
Ye Zhang
Chongqing Institute of Geology
and Mineral Resources
Chongqing
Network fracturing horizontal wells is efficient at the beginning of production but its advantage over multi-stage fracturing diminishes over time.
Understanding a reservoir's production capacity and flow mechanisms is critical to maximizing production, but these variables are more complex in tight reservoirs than in conventional reservoirs due to smaller pore size and special flow characteristics.
Mathematically simulated fracture-design for tight oil and gas reservoirs has been researched extensively, but relatively little work has been done using fluid flow in actual prospects.1-4
This article examines tight-reservoir fluid flow using cores from the Well Shun-9 prospect area in China's Tarim basin. Relative permeability, pressure sensitivity, and threshold pressure-gradient tests were performed on the cores.
Based on the test results, economic analysis, and reservoir simulation, this article evaluates the effectiveness of different completion methods in the Well Shun-9 drainage areas, comparable to tight reservoirs around the world. It finds that network fracturing may be uneconomic compared to multistage horizontal fracturing, especially after a well has been producing for 3 years or more.
Parameters, core properties
Measuring relative permeability is the first step in investigating flow behavior for any reservoir. In tight reservoirs, however, there is more interference between two phases, larger flow resistance, and a more obvious threshold pressure gradient, making measurement complex.
Published studies on oil-water relative permeability in tight oil reservoirs are scarce, though methods and results have been introduced regarding gas-water relative permeability.56 These studies provide overviews of gas-water relative permeability using common methods like injecting gas and water under steady-state conditions, as well as alternative methods such as capillary-pressure measurements on unconfined samples.
For this article, however, we applied the relatively simple and effective non-steady state method for measuring the relative permeability of tight cores.
Well Shun-9 has an average gas permeability of 0.18 md.7 The formation oil at reservoir condition has a viscosity of 1.44 MPa·s at ambient temperature and ultimate viscosity of 1.96 MPa·s. Oil density is 0.8027 g/cu m. Both the formation water and injection water had salinity of 8,888.66 mg/l.
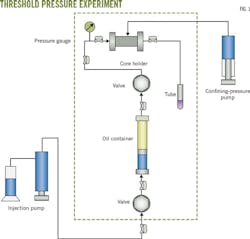
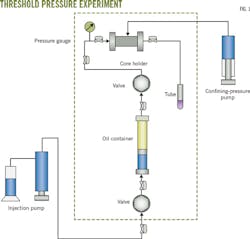
Fig. 1 shows our approach to measuring threshold pressure, comprised of a fluid-injection pump, core holder, confining-pressure pump, and an intermediate-oil container. An intermediate-water container was connected to the core holder to measure relative permeability.
To analyze formation pressure we maintained upstream pressure at about 0.3 MPa and downstream pressure at about 0.1 MPa with an average pore pressure of 0.2 MPa.
We slowly increased confining pressure. Beginning at 3 MPa and moving to 5 MPa, 10 MPa, 20 MPa, 30 MPa, 40 MPa, and 50 MPa at 30-min intervals. At each pressure, nitrogen gas must flow into the core for at least 30 min to measure gas permeability.
Once gas permeability was measured, we decreased confining pressure back to the starting values and waited 1 hr for each pressure to equilibrate.
To measure threshold pressure the cores were vacuumed for at least 8 hr and saturated with oil. Five pressure points were applied and the flow rate was recorded until pressure stabilized.
Threshold-pressure results were modified with effective-stress sensitivity data to improve accuracy because the confining pressure was increasing along the core during the experiments. The flowrate-versus-pressure gradient was plotted and the threshold-pressure gradient obtained from the plots.
The relative permeability measurements used the non-steady state method and the selected cores were saturated with prepared formation water and installed in the core holder. Water was injected at 0.2 ml/min until 10 pore volume (PV) to reach water-effective permeability.
Oil injected into the core displaced water until 10 PV, or until water was no longer produced, to establish connate water saturation. Finally, water was injected to displace oil until 30 PV, and data were recorded.
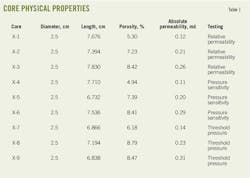
Table 1 lists the physical properties of Well Shun-9 sandstone cores including length, diameter, porosity, and gas permeability. Nine cores were used and divided into three groups for each test according to their permeability value.
Permeability values generally are obtained by looking at stress dependency and fracture closure and reopening, which affect reservoir permeability and production. Fracture closure is one of the main mechanisms for a high decline rate in early production.
We, however, combined stress-sensitivity data to analyze relative permeability results. Fracture effect was not taken into consideration because our sample core fractures were already closed due to the change in pressure between downhole and the lab. This analysis can take several months using a large tight-core sample. Sensor and pump drifts can reduce accuracy over time, so a small sample is recommended.
Relative-permeability curves
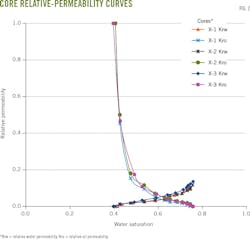
Fig. 2 shows the relative-permeability curves of three Well Shun-9 cores (X-1, X-2, X-3) under reservoir conditions. Table 2 shows the key reservoir features. The cores' permeability was 0.12-0.26 md and the curves show good repeatability.
A tight-oil reservoir exhibits different relative permeability than a conventional reservoir, including large connate water saturation, large residual oil saturation, and a narrow two-phase flow zone.
Displacement efficiency, which is also recovery efficiency in laboratory conditions, is lower than 60% for tight-rock samples, and the lower the rock permeability the smaller the recovery efficiency.
This trend of relative permeability curves shifting with a core's absolute permeability is not obvious, however, because the permeability of the three cores is too similar. All three samples exhibit water-wetting features.
Understanding the relative permeability of oil and water is important for the Well Shun-9 area because the reservoir has high initial water saturation (46%). The area also contains bottom water that can enter the oil zone during horizontal fracturing if the fracture height is not well controlled.
Relative permeability data shows that a small increase in water saturation will lead to a considerable decrease in oil relative permeability, which can greatly reduce oil production.
Pressure-sensitivity analysis
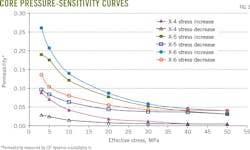
Pressure sensitivity is an important feature of any tight oil reservoir because it affects fluid flow and overall oil production. Fig. 3 illustrates the pressure-sensitivity analysis of three Well Shun-9 cores (X-4, X-5, X-6) using nitrogen as the gas medium.
To determine pressure sensitivity, we began with a confining pressure of 3 MPa and a corresponding effective stress of 2.8 MPa. For convenience, the confining pressure was taken as equal to the effective stress, despite the 0.2 MPa difference. The upper effective-stress value was set at 50 MPa to simulate formation pressure of 74.2 MPa.
Fig. 3 shows the relationship of the core's gas permeability with effective stress. At the beginning, permeability decreases quickly with increasing effective stress, but the drop slows after 30 MPa. Permeability at an effective stress of 50 MPa can decrease to as little as one-tenth of the original permeability. Compression began in pore throats rather than pore bodies and the permeability decrease was subject mainly to throat constraints.8 After effective stress dropped to a certain value, the shrinking of the openings in the rock reached its minimum and the decrease of permeability became equal to overall well-decline rate.
Permeability increased very slowly for all three cores studied during the first stage of the recovery-buildup process and the relationship curves are almost as flat. This similarity between the curves reflects plastic deformation of the reservoir rock under high effective stress (in this case >30 MPa), with elastic deformation more obvious at lower stress.
The stress decrease curve deviates sharply from the stress increase curve, confirming irreversible permeability damage during oil production.
Cores X-4, X-5, and X-6 had permeability losses of 68%, 49%, and 48%, respectively, when effective stress was reduced to 3 MPa from 50 MPa. At 3 MPa, permeability is about one-third its original value.
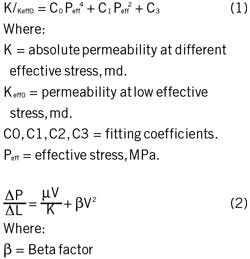
Testing established a correlation to describe the stress-permeability relationship for stress sensitivity (Equation 1).
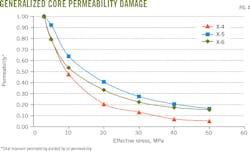
Fig. 4 plots the relationship between K/Keff0 and effective stress. The trend satisfies a quadruplicate functional-equation form and the correlation coefficient is larger than 0.995. Pressure sensitivity in the Well Shun-9 area has a considerable impact on pore structures and oil production rates.
Threshold-pressure gradient
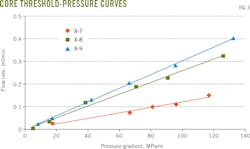
Fig. 5 shows the linear relationship between flow rate and formation pressures. The curves, however, do not pass through the original of the coordinates, a feature of non-Darcy flow.
The regression line meets the x-axis and the intercept is threshold pressure. The threshold-pressure gradient can be calculated using threshold pressure divided by the length of each core and it increases as the permeability of rock decreases.
When the permeability of the cores increases to 0.23 md (Core X-8) and 0.31 md (Core X-9) from 0.14 md (Core X-7), threshold pressure decreases to 0.31 MPa/m and 0.20 MPa/m, respectively, from 0.66 MPa/m.
The average threshold pressure gradient is 0.32 MPa/m for the cores examined, which is high compared with conventional reservoirs.
A high threshold-pressure gradient requires reasonable well-bottom flow pressure for oil to flow into the wellbore. Lowering the well-bottom flow pressure increases oil production but the effect is limited because of formation damage caused as formation pressure decreases and effective stress on the rock increases.
The permeability drop counteracts the increased pressure differential and, based on the pressure-sensitivity analysis, rock permeability can drop to almost zero and may even make the well lose productivity.
Reservoir simulation, model
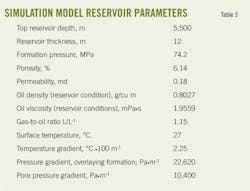
A numerical simulator modelled Well Shun-9 fractures. Reservoir properties, black-oil PVT tables, and relative permeability curves were analyzed and put into the model, with non-Darcy effects taken into account. Table 3 describes the simulation's reservoir parameters
The model places one production well in the center of a 3,240 m × 2,040 m block. For a vertical well, the wellbore is in the middle of the block, and for a horizontal well, the horizontal section is evenly distributed along the model center.
Fractures modeling used narrow, high-permeability grids, with grid transmissibility equal to fracture conductivity. The grids were gradually refined toward the wellbore to avoid convergence problems.
Explicitly building the fracture into the model allows calculation of the matrix-to-fracture flow for each step in each grid block. The fracture geometry, direction, and connectivity with the wellbore are modeled based on fracture design and geo-mechanical studies from the oil field.
The fracture's impact appears only as a modification to the productivity of the well without any representation of the physical matrix-fracture interaction. There is no quantification of geological heterogeneity's effect.
The data used in the simulation model came from field operators or were generated in the laboratory. Relative permeability data were used because of Well Shun-9's high initial water saturation.
The fracture-design simulator estimated average fracture width and conductivity. We established fracture parameters for each completion method tested that included horizontal section length, flow conductivity, length of intervals between fractures, half-fracture length, number of stages, and for network fracturing, the scale.
Non-Darcy effects
Flow in porous media follows Darcy's law when it is laminar. In tight oil reservoirs, however, flow deviates from Darcy's law due to the threshold-pressure gradient.
Equation 2 represents general flow through porous media.9 The left side of the equation represents pressure gradient. The top term on the equation's right side represents Darcy flow. The bottom term represents non-Darcy flow. The Beta factor is a function of the shape of pore throats, porosity, and permeability.
Multi-rate well tests, correlations, or core testing can determine the Beta factor: the lower the permeability, the larger the Beta factor and the greater the non-Darcy effects. Despite a fracture's high conductivity, pressure losses due to non-Darcy effects can be significant and ignoring them can result in overestimating production.
Reservoir simulators have options to input the beta factor for each layer or to calculate it using porosity and grid permeability. This enables more accurate flow models by accounting for changes in pressure and fluid saturation along fractures.
Simulation results, economics
Comparing pressure distribution and drainage area allows analysis and comparison of a reservoir's production parameters under different completion methods.
Fig. 6 shows pressure-field distribution after producing for 1 year under different completion methods. The shape and size of the pressure contour reflect the drainage area's scope.
Table 4 shows daily and cumulative oil production using different completion methods at 1 month, 3 months, 1 year, and 3 years, larger drainage areas having greater production. For horizontal and vertical-well development, network fracturing improves productivity more than conventional fracturing and both are better than not fracturing at all. Network fracturing horizontal wells shows efficiency at the beginning of production but its advantage over multi-stage fracturing diminishes over time and the increased cumulative production is only 14.7% higher after 3 years (Table 4).
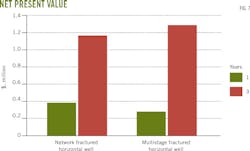
Fig. 7 shows net present value for the two completion methods. Each method is profitable at assumed economic parameters. Network fracturing is more efficient for a short time and multi-stage is more efficient for periods >3 years.
Acknowledgments
The authors acknowledge the financial support of the National Program on Key Basic Research Project (973 Program, No. 2015CB250904) and Key Project of National Science Foundation of China (No. 41330319).
References
1. Belyadi, A., Aminian, K., Ameri, S., and Boston, A., "Performance of the hydraulically fractured horizontal wells in a low permeability formation," SPE Eastern Regional Meeting, Morgantown, WV, Oct. 13-15, 2010.
2. Sehbi, B.S., Kang, S., Datta-Gupta, A., and Lee, W.J., "Optimizing fracture stage and completions in horizontal wells in tight gas reservoirs using drainage volume calculations," North American Unconventional Gas Conference and Exhibition, The Woodlands, Tex., June 14-16, 2011.
3. Bunger, A.P., Zhang, X., and Jeffrey, R.G., "Parameters affecting the interaction among closely spaced hydraulic fractures," SPE Hydraulic Fracturing Technology Conference, The Woodlands, Tex., Jan. 24-26, 2011.
4. Wu, R., Kresse, O., Weng, X., Cohen, C.E., and Gu, H.,"Modeling of interaction of hydraulic fractures in complex fracture networks," American Geophysical Union, Fall Meeting, San Francisco, Calif., Dec. 9, 2011.
5. Byrnes, A.P., "Understanding, Exploring, and Developing Tight-Gas Sands, Chapter 5: Issues with Gas Relative Permeability in Low-Permeability Sandstones," the American Association of Petroleum Geologists Hedberg Series, No. 3, 2008, pp. 63-76.
6. Cluff, R.M., and Byrnes, A.P., "Relative Permeability in Tight Gas Sandstone Reservoirs: The Permeability Jail Model," SPWLA 51st Annual Logging Symposium, Perth, June 19-23, 2010.
7. Khan, W.A., Rehman, S.A., Akram, A.H., and Ahmad, A., "Factors affecting production behavior in tight gas reservoirs," SPE/DGS Saudi Arabia Section Technical Symposium and Exhibition, Al-Khobar, Saudi Arabia, May 15-18, 2011.
8. Lei, Q., Xiong, W., Yuan, J., Cui, Y., and Wu, Y.S., "Analysis of stress sensitivity and its influence on oil production from tight reservoirs," SPE Eastern Regional Meeting, Lexington, Ky., Oct. 17-19, 2007.
9. Dake, L.P., "Fundamentals of Reservoir Engineering," 17th edition, Elsevier, Amsterdam, 1998.
The authors
Xiuyu Wang ([email protected]) is an associate professor at the China University of Petroleum, Beijing. She holds a Ph.D from the University of Wyoming, Laramie, and is a member of the Society of Petroleum Engineers.
Shenglai Yang is a full professor at the China University of Petroleum, Beijing. He holds a Ph.D from the China University of Mining and Technology, Beijing, and is a member of the Society of Petroleum Engineers.
Yu Pu is an MS candidate at the China University of Petroleum, Beijing.
Feng Zhou is an engineer for Sinopec's Southwest Oil & Gas Co. He holds an MS in petroleum engineering from the China University of Petroleum, Beijing.
Ye Zhang is vice president of the Chongqing Institute of Geology and Mineral Resources in China. He holds an MS in petroleum engineering from Chengdu University of Technology, China.
