Refracturing increases recovery in mature unconventional assets

Mark Fleming
Robert Barba
Triple R Energy Partners
Houston
Refracturing previously uncompleted portions of organic shale wellbores can significantly mitigate the expected production plateau from shrinking inventories of new Tier 1 locations in US shale plays. Oil and gas stranded volumes between widely spaced legacy well-perforation clusters contain reserves which can be successfully recovered with mechanically isolated refrac treatments.1 There are more than 58,000 wide-cluster spacing wells in the major organic shale plays and a modest refracturing program that stimulates 10% of available candidates should increase US daily production by 1.5 million bo/d and 11.7 bcfd.
Refrac opportunity
A typical well completion before mid-2016 had cluster spacings > 40 ft with 50% non-producing clusters (resulting in an 80-ft effective cluster spacing). The expected increase in total recoverable oil for an 80-ft cluster-spaced well is just under 4:1. Based on vertical well history, early generation horizontal fracture cluster-spacing assumed that matrix permeability was high enough to adequately drain the reservoir volume. In 2016, ConocoPhillips Co. drilled a pressure monitoring well 70 ft away from a well completed in 2014 to determine drainage distance from the wellbore. Total drainage was only 7.5 ft with clusters spaced 50 ft apart, and 85% of the reservoir was not drained by the wide cluster-spaced completion. In mid 2016, ConocoPhillips operations in all basins subsequently decreased cluster spacings to < 40 ft.
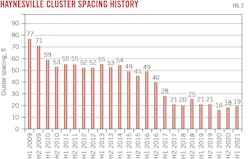
Haynesville case histories demonstrate close cluster-spacing recovery improvement, where normalized estimated ultimate recovery (EUR) increases as cluster spacing decreases (Figs. 1-2). These results indicate that refracs can access large oil volumes in wells with widely spaced cluster intervals.
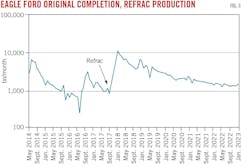
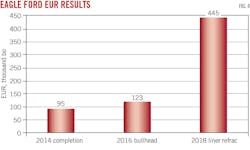
For example, a 2018 liner refrac from the Eagle Ford showed an increase in EUR to 445 thousand bbl oil (MBO) from 95 MBO compared with the initial 2014 frac treatment (Figs. 3-4). This uplift is slightly better than the P50 uplift observed in single-well lease refracs in a play averaging 330,000 bo/well recovery. Expected return on investment is more than 3:1 for a P50 well.
On a macro basis, the total US production uplift expected from refracturing just 10% of 58,000 wide cluster-spaced wellbores is more than 1.5 million bo/d and 11.7 bcfd.2 This includes wellbores from the Eagle Ford, Haynesville, Permian Wolfcamp, Marcellus, Bakken, Niobrara, Woodford, and Barnett.
In addition to expected uplift, refracs make possible booking of behind-pipe P1 reserves. Several senior reservoir engineers at major reserve auditing companies indicate that upcoming refracs in specific wellbores technically meet the definition of behind-pipe P1 reserves in most aspects. It is not widely adopted because the industry does not yet recognize similarities between refracs and recompletions in vertical and horizontal wellbores. For comparison, refracturing refers to pumping into existing perforations without mechanical isolation while recompletion refers to pumping into entirely new perforations inside expandable or cemented liners. Within that context there is no difference between unperforated zones in vertical wells and previously unstimulated intervals in a horizontal organic shale well. Denham Capital Management LP was the first entity that proposed a framework for booking behind pipe stranded reserves in 2015, and the concept was presented again in 2023 at the Society of Petroleum Engineers (SPE) Annual Refracturing workshop in Denver.3 4
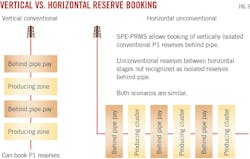
Fig. 5 shows a comparison between a vertical well with bookable behind-pipe reserves and a horizontal well with reserves behind pipe between stages. Vertical well behind-pipe reserves traditionally included formations isolated by shale or low permeability sand barriers, and the extremely low matrix permeability in continuous organic shales is effectively a drainage barrier analogous to an isolated formation. SPE guidelines allow for behind pipe zones to be booked in conventional isolated reservoirs, and it is reasonable to apply similar bookings to unconventionals if the ability to consistently access these oil and gas reserves can be demonstrated under the reliable technology clause. If 1% of the 15,000 refrac candidates in the Eagle Ford were booked, that pay would represent a $554 million increase in bankable assets.
Liner refrac benefits
There are two types of refracs: bullhead (pumping down the original casing through the original perfs) and liner recompletions (pumping down a perforated insert liner isolating the original liner perfs). While bullheads are typically economic due to their lower cost ($500,000-600,000 vs. $4-5 million for a liner refrac), the productivity per foot of lateral is 10 to 12 times higher with liner refracs compared with bullhead treatments.5
For liner refracs, NPV10 values are higher than infill wells when considering EUR benefits of a pressure recharged parent well in the zipper pattern. Traditional infill well EURs suffer from a pressure sink from the parent that steals 40% of the first order EURs and 20% of the second order.6
Despite well-documented successes, refracs are undercapitalized. About 90% of refracs to date in the Eagle Ford have been performed by less than 10% of companies operating there. The lack of large-scale adoption rests on a perception that new wells have better risked returns with lower overall financial and operational risk than refracs. Several studies have shown that returns on refrac investments are competitive in the stand-alone case and often superior to new wells when parent-child issues exist. The risks of performing liner refracs is managed using three best practices.
Best practices
The first best practice includes a candidate selection process based on oil in place-gas in place (OIP-GIP) and well spacing. The remaining stranded oil is the difference between current cumulative production and 14% of the drainage areas for oil and 60% for gas. These factors approach the 15% expected maximum oil recovery factor for solution gas-drive oil reservoirs and 70-80% for dry gas reservoirs. The slightly lower expected recovery factors in the laterals result from cluster spacings too wide to drain the narrow slivers of stimulated rock volume from each cluster. In the ConocoPhillips Eagle Ford drainage pilot, there was only 7.5 ft of lateral drainage bracketing each cluster within a 50-ft legacy stage. Recent completions use 15-20 ft cluster spacings.
Integration of petrophysical analysis and structure maps provide recoverable oil and gas estimates. The difference between total post-refrac expected recovery and cumulative production estimates total recovery. This method assumes that 100% cluster efficiency is obtained using the best practices outlined below. An alternate method assesses refrac potential in the event of poor openhole well-log control and uncertainty in volumetric estimates.
This technique reviews recent close cluster-spaced completions in the area where new wells have similar OIP to refrac candidates or wells that are on strike structurally within a local area in plays like the Eagle Ford. Analogs should be from the same phase window when fluid properties change from oil to volatile oil and ultimately to gas when migrating updip in a play.

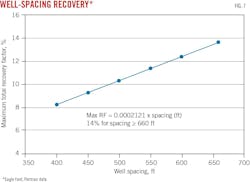
In a recent Eagle Ford study in LaSalle County, a comparison of the maximum post-refrac total EUR (post-refrac decline plus pre-refrac cumulative production) shows a 30% higher expected maximum recovery factor (RF) compared with the P10 EUR/ft from new well offsets (Fig. 6). Offset EUR/ft analysis should use P10 or P5 due to the variability in completion practices among operators.
This variability results from operators shooting multiple small-diameter phased perforations in each cluster and pumping under low perforation friction pressure for new well-fracturing treatments. For example, an upcoming refrac program candidate originally completed in 2018 contains close-cluster spacing but was treated with only 200 psi of perforation friction, resulting in only 8.2% RF. By contrast, a properly designed refrac should yield about 14% RF and deliver 326,000 bbl oil of incremental production using best perforating practices which include single large diameter 0° top side oriented perforations in each cluster and a 2,500-3,000 psi friction pressure drop across the perforations.7
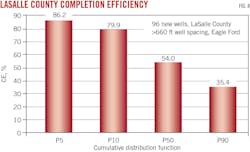
To supplement the above analysis, the LaSalle County database provided additional estimates for apparent cluster efficiency. The analysis incorporated the maximum total recovery factor for the well spacing shown in Fig. 7. Completion efficiency (CE) compares the actual recovery factor with the maximum RF/well spacing. It incorporates both cluster spacing and degradation from adverse parent-child interactions. For example, a 14% recovery factor for a new well with more than 660-ft spacing would have CE = 100%. The distribution in Fig. 8 shows that CE P50 = 54% and suggests that if parent-child issues are not a factor, about half of recoverable oil is left in the ground even with modern close-cluster spacing and high proppant loading.
This finding corresponds with a 4,500-stage step down test analysis performed by Tap Rock Resources LLC in Delaware basin. The study found that P50 CE = 47% for phased perforations with low perforation friction pressure compared with 93% for 0° top oriented perf-cluster stages and > 2,100 psi perforation friction. The latter cluster stages contained large-diameter perforations. The study also found that using two smaller perforations staged at 0° instead of one large perforation delivered a lower CE (78%) even though initial perforation friction was > 2,000 psi. Higher erosion damage in the smaller holes and subsequent loss of perforation friction during the treatment most likely caused CE degradation. Single large-diameter holes result in lower breakdown pressures and lower tortuosity than multiple smaller holes.
The second best practice requires proper wellbore preparation before running mechanical isolation. Well-preparation organizations in the two largest refrac operations in the Eagle Ford report 95% success getting liners to bottom with clean and tested wellbores. Recommended pre-refrac diagnostics include a downhole ultrasonic tool to determine wall thickness and other casing anomalies. The original casing should be pressure tested uphole of the highest defect where the refrac liner top will be positioned. These procedures identify casing defects requiring mechanical isolation to determine the top of the isolation liner. Once that depth is determined, the pressure test can be done above that point.
The third best practice involves proper execution of the refrac treatment. Refracs do not introduce increased risks over standard initial completion plug and perf operations. For plug-and-perf, best practices include one 0° top side perf per cluster, 3,000 psi perforation friction, and 25-ft minimum cluster spacing for longitudinal fracture avoidance. Offset pressure monitoring is recommended to determine if bioball (spherical polylactic acid diverter material) or pod drops (dissolvable fiber material) are needed to control fluid leakoff and prevent initial fracture runaways into longitudinals. Sealed wellbore pressure monitoring in adjacent wells detects high fluid-loss clusters.
In Eagle Ford and Haynesville, a valid recompletion strategy reorientates refracs in the 25-ft cluster spacing stages even though 100% of the initial perforations were probably not open. Reorientation accesses legacy virgin rock between drained clusters through new perforations. These plays are in an extensional tectonic environment with relatively low contrast between maximum and minimum principal horizontal stresses. The original drainage area follows planar fractures propagating in the direction of the maximum principal horizontal stress, and depletion results in stress reversal in which the initial maximum principal stress becomes the minimum stress. Fractures will therefore reorient 90°, parallel to the wellbore, as documented in Eagle Ford.8
On nearly every pad in Eagle Ford and Haynesville where refracs were either on the pad or adjacent to the pad, the refractured wells had higher total recovery factors than new completions where total recovery factor combines the post-refrac EUR with pre-refrac cumulative production.
In other areas with high horizontal-stress anisotropy due to anisotropic compressional tectonic strain, the refracs should not reorient without significant reservoir pressure depletion. In the Eagle Ford study, the refractured wells were poorly completed with small-diameter phased perforations and low-perf friction pressures, yet the apparent cluster efficiency was 94%.
During stress reorientation, the original perforations should be analyzed for evidence of erosion with the same ultrasonic evaluation suite that evaluates wall thickness and liner placement. In areas with unstimulated clusters (no observed erosion), cluster spacing can be reduced to 15 ft because there are no longitudinal fractures present. Recommended areas for this analysis include the Permian, Mid Continent, Williston, DJ, and Powder River basins. Refrac reorientation in the Barnett was documented early in the development of the play with vertical-well microseismic analysis.
While the number of refracs in areas like the Permian are limited, it is possible that operators who attempted refracs ignored this issue and avoided reperforating previously unstimulated clusters. P50 cluster efficiency of 47% was reported for legacy completions in the Permian, indicating that more than half of the original clusters never produced. If these are not targeted with new perforations inside the refrac liner, significantly lower uplift can be expected from refracs in the Permian relative to Eagle Ford or Haynesville recompletions which experience reorientation.
References
- Barba, R.E., “Analysis of Organic Shale Refracs,” Harts Oil and Gas Investor, HFT 54, Aug. 1, 2022.
- Barba, R.E., “Study Highlights Upside of Refracturing Older Wells in Organic Shale Plays,” American Oil and Gas Reporter, Vol. 66, No. 1, January 2023.
- Holroyd, Samantha, “Refrac Integration in the Capital Deployment Plan,” Energy Forum refrac conference, Houston, Tex., Dec. 10-11, 2015.
- Barba, R. and Fleming, M, “A Review of the Selection Process for Refrac Candidates,” SPE workshop, Refracturing: A Proven Strategy to Maximize Economic Recovery, Denver, Colo., Aug. 14-15, 2023.
- Eichinger, K., French, S., Day, K., Brady, J., Epperson, R., Leonard, R., and Leonard, B., “Hybrid Expandable Liner System: A Performance-Enhancing, Cost-Effective Alternative to Bullhead Refracturing,” URTeC-3855094, Unconventional Resources Technology Conference, Denver, Colo., June 13-15, 2023.
- Barba, R.E. and Fleming, M., “The High Cost Of Poor Child Protection: Economic Evaluation At The Pad Level With Primary Well Refracs” SPE-212371, SPE Oklahoma City Oil and Gas Conference, April 19, 2023.
- Churchwell, P., McQueen, A., and Weddle, P. “Optimization of Perforation Efficiency in the Delaware Basin Through XLE Perforating and Innovative Perforating Charge; A Case Study,” SPE-212345-MS, SPE Hydraulic Fracturing Technology Conference and Exhibition, The Woodlands, Tex., Jan. 31-Feb. 2, 2023.
- Barba, R., Allison, J., and Villarreal, M., “A Comparison of Latest Generation Frac New Well and Refrac Results with Evidence of Refrac Reorientation,” URTeC-3724057, Unconventional Resources Technology Conference, Houston, Tex., June 20-22, 2022.
The Authors
Bob Barba ([email protected]) is CEO of Triple R Energy Partners and Integrated Energy Services in Houston. He holds a BS (1975) from the US Naval Academy and a MBA (1981) from the Warrington College of Business. He is a member of the Society of Petroleum Engineers, American Association of Petroleum Geologists, Society of Petrophysicists and Well Log Analysts, American Rock Mechanics Association, and the Canadian Well Logging Society.
Mark Fleming ([email protected]) is president and co-founder of Triple R Energy Partners in Houston. He holds a BS (1989) in Petroleum Engineering from Mississippi State University and an MS (1993) in Petroleum Engineering from the University of Texas. He is a member of both the Society of Petroleum Engineers and the Society of Petroleum Evaluation Engineers.