Log-derived permeability describes reservoir heterogeneity
Martin Essenfeld
EGEP Consultores SA
Caracas
Rafael Sandrea
IPC Petroleum Consultants Inc.
Tulsa
Log-derived permeabilities provide reliable estimates of reservoir Dykstra-Parsons Variance (DPV) when laboratory-measured core permeabilities are not available. They also provide broader and deeper coverage of heterogeneity throughout the entire reservoir and are used to compare DPV with net-to-gross (N/G) approaches.
Twenty-five sandstone and carbonaceous producing units were analyzed with DPV using core and log data. Results show that, in the absence of core-derived permeabilities, log-derived permeabilities reliably estimate DPV in development wells, guaranteeing heterogeneity coverage over the entire reservoir.
Additionally, comparison of a broad range of reservoir sands, from clean to very shaly, demonstrated the reliability of log-derived permeabilities. The alternative N/G model defining heterogeneity showed substantial scatter, with values frequently much higher or lower than corresponding DPV values.
Waterflood modeling
Waterflooding is the most common method of complementing the natural depletion energy of oil reservoirs with natural recovery factors of 22-25%. Waterflooding can add 10-15% recovery, more when combined with surfactants, polymers, and slugs of CO2 and natural gas. It is now standard practice to start water injection at the onset of new field development, particularly in offshore fields (which comprise 70% of all new oil discoveries worldwide).
Early water injection and stranded gas injection are credited with the average recovery factor of almost 50% in the North Sea, the highest regional recovery factor in the world. In the US, waterflooding contributes to more than half of traditional oil production (excluding unconventional production) and to its nearly 40% overall average recovery factor. There are large waterflood projects in the Middle East with injection rates of more than 4 million b/d.
Critical to recovery efficiencies of waterflood projects are two intrinsic controlling factors: fluid and reservoir characteristics. Fluid viscosity controls mobility ratio, the determining factor of areal efficiency and a significant part of the vertical sweep. Five well-established reservoir characteristics (permeability, porosity, net hydrocarbon pay, heterogeneity, and pore-pressure gradient) fundamentally define well-productivity and injection rates. Further, pore-size distribution controls microscopic displacement which combines with gross volumetric sweep to estimate ultimate recovery limits.
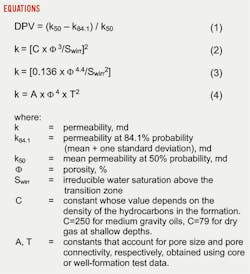
Other than the pore-size distribution obtained from displacement experiments, the afore-listed reservoir characteristics, except for heterogeneity, are log-derived. Dykstra-Parsons determined heterogeneity by using core-established permeability at 1-ft intervals to establish DPV through a variance relationship (Equation 1).
This DPV-permeability relationship is historically used as the heterogeneity indicator within the industry (OGJ, Dec. 4, 2017, p. 40). Its major limitation has been that it is obtained from a small number of samples removed from the reservoir through coring, which correspond to a very small portion of the reservoir’s total volume. Core data are expensive and risky to obtain, especially now that wells are drilled to deeper horizons associated with high pressures and temperatures. For these reasons, coring is done in only a few wells (about one in five) and at discrete intervals, providing limited data over the entire reservoir.
Modern reservoir simulators cover the entire reservoir in detail and produce real-time injection profiles to adjust operations and optimize oil recovery and NPV. In this context, N/G, readily available from logs, has been used as an alternative to DPV in multiple grid cells in reservoir simulators and in defining reservoir-quality index (RQI), providing analytical relationships of well-productivity in new discoveries (OGJ, Dec. 5, 2016, p. 55; OGJ, Jan. 3, 2022, p. 30). N/G ranges from one to zero, with one corresponding to a homogeneous reservoir.
This work adapts the DPV technique by using log-derived instead of core-derived permeabilities for instances in which laboratory-measured core permeabilities are not available. This provides broader and deeper coverage of heterogeneity throughout the reservoir and a comparison between the DPV and N/G approaches. The study covers a wide spectrum of 25 mostly sandstone and some carbonaceous producing units with appropriate core and log data.
Estimating reservoir heterogeneity
In this study, DPV is determined using permeability obtained from laboratory measurements, which itself is not directly available from logs. Modern logging methods, however, provide good estimates of formation permeability, based on reliable relationships with porosity and irreducible water saturation in most reservoir formations. One of the early models developed by Wyllie and Rose is shown in Equation 2. Irreducible water saturation is required in this model since it is a necessary condition for the validity of the estimated absolute rock permeability.
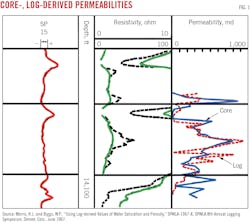
Fig. 1 compares log- and core-derived porosities and permeabilities over an interval of 64 ft of Louisiana Miocene gas sand. Average core permeability is 320 md compared with 280 md for the log-derived permeability. Two variations to the original permeability model have been developed in addition to the Wyllie-Rose model: Timur (Equation 3) and Schlumberger-Doll-Research (SDR) (Equation 4).
All three models treat permeability as an exponential function of porosity and, in general, provide similar and reliable continuous k-estimates. This study uses Wyllie-Rose to calculate DPVlog. Corresponding DPVcore were calculated from respective core data. Swirr embodied in the different permeability models are obtained from well logs using variants of Archie’s law (1942) for heterogenous sands, as will be discussed below.
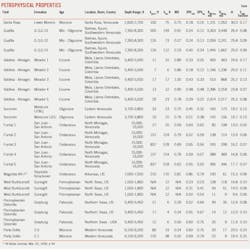
The table summarizes DPVcore, DPVlog, and N/G for 25 producing units from reservoirs of different types in three countries. The reservoirs are grouped into three lithological and permeability categories: clean sands above 500 md, typical shaly sands in the 100–500 md range, and tight-shaly-carbonaceous sands below 100 md. There are a couple of reservoirs with k50 permeabilities that fall on the edges of the above ranges. Two reservoirs are included with special anomalies (gas and oolites). For inclusiveness, the table also provides ancillary data such as reservoir age, depth, thickness, k50 permeability, porosity, and irreducible water saturation.
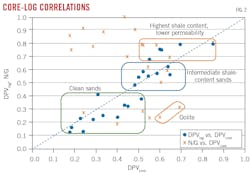
The graph also shows that N/G defines heterogeneity distinctly from the DPV concept. N/G values are, in general, higher than corresponding DPV values for clean, high-permeability sands and considerably lower for shaly reservoirs. Oolites exhibit extreme differences. Overall, N/G values show significant scatter. N/G describes the flow capacity (k × hnet) of each producing interval, however, absolute values for different vertical sections are not a valid indicator of heterogeneity compared with DPV, which has a characteristic spread of k-horizontal values for each layer.
Water saturation correction
Fig. 3 shows a cross plot between k50 calculated from cores and logs for the 25 producing units listed in the table. The correlation verifies the validity of this study’s permeability model and the premise that the DPV technique can be adapted to using log-derived instead of core-derived permeabilities.
Acknowledgements
Special thanks to Yeni Ferreira, EGEP, for all data handling and additional data interpretation, and Miguel Castillejo, Universidad Central de Venezuela, for helping with data research.
Bibliography
Alfonzo M.F. and Caicedo D., “Simulación Numérica del Yacimiento U2M, L del Campo Socororo Este,” graduate thesis, Universidad Central de Venezuela, Nov. 4, 2011.
Aufricht, W.R. and Koepf, E.H., “The Interpretation of Capillary Pressure Data for Carbonate Reservoirs,” 826 AIME 1957, Permian Basin Oil Recovery Conference, Midland, Tex., April 18-19, 1957.
Bryant, S.L., Cade, C.A., and Melor, D.W., “Permeability Prediction from Geological Models,” AAPG Bulletin, Vol. 77, No. 8, Aug. 1, 1993, pp. 1338–1350.
Carreño D. and Zarate D., “Plan Estratégico de Producción Campo Guafita,” graduate thesis, Universidad Central de Venezuela., 2014.
Chang, D., Vinegar, H.J., Momss, C.E., and Straley, C., “Effective Porosity, Producible Fluid and Permeability in Carbonates From NMR Logging,” The Log Analyst, Vol. 38, No. 2, June 19, 1994, pp. 60-72.
De Souza, A.O. and Brigham, W.E., “A Study on Dykstra-Parsons Curves,” Tech. Report 29, Stanford University, 1980.
Díaz, C. and Sandoval, B., “Evaluación Arena MO-I Campo Santa Rosa,” graduate thesis, Universidad de Oriente, 2014.
Dykstra, H. and Parsons, R.L., “The Prediction of Oil Recovery by Waterflood in Secondary Recovery of Oil in the United States,” 2nd Edition, API, 1950.
Craig, F., “The Reservoir Engineering Aspects of Waterflooding,” SPE Monograph, 1971.
Galindo, V. and Poveda, M., “Desarrollo Optimo del Campo Valdivia Almagro,” cp-33-00058, 8th Simposio Bolivariano – Exploración, Sept. 21, 2003.
Lanza, E. and Ramírez, E.L., “Determinación de Petrofacies y Unidades de Flujo en la Sección Cretácica del Campo El Furrial, Cuenca Oriental de Venezuela,” graduate thesis, Universidad Central de Venezuela, June 2007.
Morris, R.L. and Biggs, W.P., “Using Log-derived Values of Water Saturation and Porosity,” SPWLA-1967-X, SPWLA 8th Annual Logging Symposium, Denver, Colo., June 1967.
Pomar, M., Esteban, M., Martinez, W., Espino, E., Castillo de Ott, V., Benokics, L., and Leyva, C., “Oligocene–Miocene Carbonates of the Perla Field, Offshore Venezuela: Depositional Model and Facies Architecture, AAPG Memoir 108, Jan. 1, 2015, pp. 647-673.
Sam-Marcus, J., Enaworu, E., Rotini, O.J., and Seteyeobot, I., “A Proposed Solution to the Determination of Water Saturation using a Modelled Equation,” Journal of Petroleum Exploration and Production Technology, Vol. 8, Feb. 24, 2018, pp. 1009-1015.
Stalnaker, D.B. and Darrell, B., “West Burkburnett Waterflood – A Successful Shallow Project in North Texas Field,” Journal of Petroleum Technology, Vol. 18, No. 8, Aug. 1, 1966, pp. 919-923.
Timur, A., “An Investigation of Permeability, Porosity and Residual Water Saturation Relationships for Sandstone Reservoirs,” The Log Analyst, Vol. 9, No. 4, Jul. 1, 1968.
The authors
Martin Essenfeld is president of EGEP Consultores SA He holds a PhD (1970) in petroleum and natural gas engineering from Penn State, is a life member of SPE, and has more than 30 years teaching experience while working with EGEP.
Rafael Sandrea is president of IPC Petroleum Consultants Inc. in Tulsa. He holds a PhD (1967) in petroleum engineering from Penn State and is a life member of SPE, member of the UN ad hoc Group of Experts on Fossil Resources, Geneva, and a distinguished fellow at EPRINC.
