Lockhart formation provides source rocks for Potwar basin

University of MalayaKuala Lumpur
Exploration and production companies should target traps above Potwar basin’s Lockhart formation to increase oil and gas production. Source-rock sedimentology for Potwar basin, host to most of Pakistan’s major hydrocarbon fields, has been well-researched, but potential of the Lockhart formation, one of the sources in the basin, had not yet been fully established.
To understand its source-rock potential, petrological techniques and organic geochemical analysis of Lockhart samples measured the type of organic matter, quality of organic matter, and thermal maturity. Organic petrographic and organic geochemical analyses indicate that the formation has good oil-gas generative capacity and may act as a significant source in the basin.
Geological setting
Potwar basin covers two thirds of eastern Pakistan and has been explored since the first commercial oil discovery at Khaur in 1914 by Attock Oil Co. The first commercial gas discovery was in 1979 in Adhi.
Early Eocene and Paleocene sedimentary deposits are prime hydrocarbon reservoir and source rocks in the basin. Organic-rich shallow marine deposits reported by Fazeelat, et al. prompted a reevaluation of formation source-rock characteristics in Potwar’s Lockhart formation.
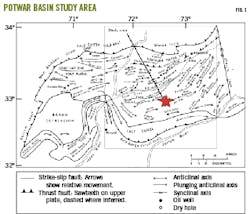
The research area lies on the north western part of Indian Shield in the Southern Potwar Deformed zone. The Kirthar Fold belt borders on the west. Potwar basin has a complex tectonic structure containing salt domes, salt-cored anticlines, duplexes, steep faults, reverse faults, and thrust fault systems (Fig. 1).
The basin’s surface geological features do not characterize subsurface structures because exposed younger molasses show anticline with gently dipping limbs. Seismic data, however, reveal overly triangular zones, duplexes, and salt-cored anticlines bounded by steep faults. Large structural patterns vary from east-west structural patterns in the western part to north-east patterns in the eastern part of the area.
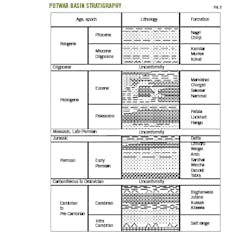
The basin consists of sedimentary structures from Late Cambrian to Holocene. Marine sequences from Miocene to Pleistocene are superimposed by 10,000-m thick alluvial sediments. Within the southern boundary of Kishore and Salt Range, rocks of Mesozoic to earlier Infra Cambrian ages are commonly exposed. In western Salt Range, Mesozoic sequence over 1,000 m thick is exposed. In eastern Salt Range, late-Cambrian rocks are exposed.
Himalayan mountain building has highly disturbed the entire northern periphery sedimentary succession between Eurasian and Indian plates since about 50 million years ago.
Petroleum system
Potential source rocks in Potwar basin are mostly Paleocene, and production primarily comes from faulted anticline traps. Identified source rocks include Wargal formation, Lockhart formation, Patala shale formation, and Khewra formation. Patala and Lockhart formations are most likely the predominant oil and gas sources in the basin. In Potwar sub-basin, source rocks are reported to be organic-rich with mature kerogen.
Reservoir rocks includes Paleogene shelf carbonates, Miocene alluvial sandstones, Jurassic and Permian continental sandstones, and alluvial and shoreface Cambrian sandstones. Oil and gas have been explored and produced from Permian Tobra, Wargal, Amb, Cambrian Khewra, Jutana, Kussak, Jurassic Dutta, Patala Shale, Khairabad, Lockhart, Nammal, Sakesar, Margalla Limestone, Chorgali, Bhadrar, and Murree formations. Discovered oilfields in Potwar are either popup structures, salt-cored anticlines, faulted anticline, or fault-block traps.
Lockhart formation tests
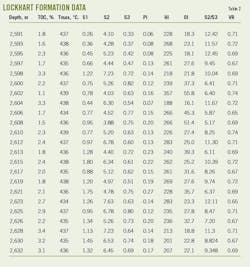
Paleocene Lockhart formation sediments came from 23 cuttings in Well A in the study area shown in Fig. 1. The samples were obtained in 1.8-2 m intervals. Laboratory studies include geochemical and petrological analyses. Sample details are shown in Table 1.
Organic petrographic analysis was carried out under oil immersion with plane polarized reflected light using a LEICA DM 600 M microscope and LEICA CTR6000 photometry system equipped with fluorescence illumination.
Samples were prepared for vitrinite reflectance (VR) studies by mounting crushed rock fragments in a mild setting polyester resin (Serifix) mixed with hardener. Cured samples were ground flat on a diamond lap and polished on silicon carbide paper of different grades (P4000, P2400 and P800) using water as a lubricant. Samples were polished to a high surface reflectance using fine alumina powder (0.05 µm, 0.3 µm, and 1 µm particle size).
Measurements of VR (in % Ro) were carried out under reflected white light using a 50X oil immersion objective with 1.58 reflective index at 23° C. A Ro = 0.589% reflectance sapphire glass standard was used for calibration. VR measurements at 546-nm wavelength were randomly sampled. Reported Ro is the arithmetic mean of 25 measurements per sample. VR for oil generation as the main fluid phase range from 0.6% to 1.3% Ro. Values greater than 2.0% Ro indicate dry gas generation.
To measure total organic content (TOC), core cuttings were crushed to less than 200 mesh. TOC was measured using LECO CS-125 elemental analyzers. Rock-Eval VI equipment was used for pyrolysis. Pyrolysis was performed on about 100 mg of crushed samples in a helium atmosphere, heated to 600° C. Parameters obtained by pyrolysis include:
- S1, the volatile hydrocarbon (HC) content (mg HC/g rock).
- S2, the remaining HC generative potential (mg HC/g rock).
- S3, the carbon dioxide yield (mg CO2/g rock).
- Tmax, the temperature at which the maximum rate of hydrocarbon generation occurs in a kerogen sample during pyrolysis analysis (°C.).
Other important calculated parameters include oxygen index (OI, mg CO2/g TOC) and hydrogen index (HI, mg HC/g TOC).
Results TOC, pyrolysis
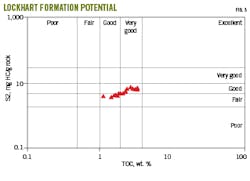
Rock organic richness is represented by TOC wt. %. According to Hunt, clastic source rock should have TOC of 1.0%. Lockhart formation sediments have 2.3% mean TOC, varying between 1.13-3.35%. Overall, the majority of analyzed samples possess good to very good TOC. TOC content decreases as thermal maturity increases, and samples having high thermal maturity would have high original TOC as compared with present day TOC.
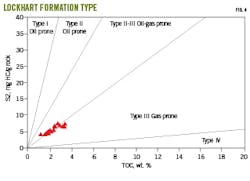
S2 is the most useful parameter generated during pyrolysis for determining hydrocarbon generative potential. A minimum of 5 mg/g is essential for good petroleum generation capacity. In Lockhart formation, S2 ranges from 3.88-7.63 mg/g. Crossplots of S2 vs. TOC indicate that Lockhart formation samples have fair to good petroleum generating potential (Figs. 3-4).
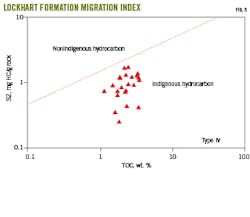
The S1/TOC migration index differentiates indigenous and migrated petroleum. Low TOC values with high S1 values show migrated petroleum. A plot of S1 vs TOC shows that all Lockhart formation samples are indigenous (Fig. 5).
Kerogen type
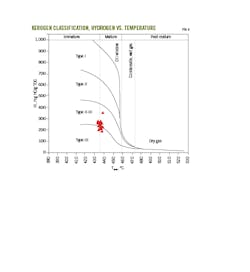
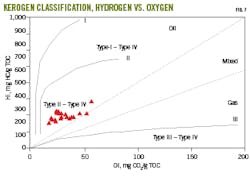
Kerogen types were evaluated based on HI and OI. Lockhart formation HI values range between 201-356 mg HC/g TOC. Kerogen classification came from Van Krevelen diagrams (Figs. 6-7). Analyzed sediments possess primarily mixed Type II-III and Type III kerogen, which agrees with S2 vs. TOC kerogen plots. Lockhart formation sediments can be considered both oil and gas-prone source rock with all samples containing relatively high HI values of 200-356 mg HC/g TOC.
Thermal maturity
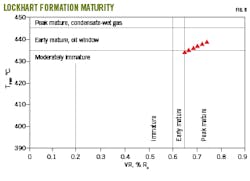
Three maturity indicators have been used in this study: Tmax, production index (PI), and VR. Table 2 shows that VR varies between 0.65% and 0.75% Ro and Tmax varies between 434° C. and 439° C. (Table 1). Details of each sample are available in Table 2.
Oil with % Ro ranging from 0.6% to 1.3% is thermogenic which is assumed to come from marine and lacustrine source rocks. Kerogen Type I and II have Tmax ranging from 430° C. to 455° C. Type III ranges from 435° C. to 465° C.
PI can also express organic matter maturity, defined as the ratio of hydrocarbons already generated (S1) to the total amount of hydrocarbons that the organic matter can generate (S1+S2). Samples are considered immature and may have generated little to no petroleum if PI is less than 0.05. If PI varies between 0.05 and 0.10, samples are considered at the end of oil generation and may have entered wet-gas production. The capacity of kerogen to produce hydrocarbons reduces if PI reaches 1.0.
Lockhart formation sediments have PI values ranging between 0.06 and 0.27, indicating that the formation has entered peak maturity for petroleum generation. This is in good agreement with Tmax and VR data (Fig. 8). The formation has good generative capacity and may act as source rock in Potwar basin.
Bibliography
Aadil, N. and Sohail, G. M., “3D geological modelling of Punjab Platform, Middle Indus Basin Pakistan through Integration of wireline Logs and seismic data,” Journal of the Geological Society of India, Vol. 83, No. 2, February 2014, pp. 211-217.
Ahmad, W. and Alam, S., “Organic Geochemistry and Source Rock Characteristics of Salt Range Formation, Potwar Basin, Pakistan,” Pakistan Journal of Hydrocarbon Research, Vol. 17, June 2007, pp. 1-35.
Asif, M., Fazeelat, T., and Grice, K., “Petroleum geochemistry of the Potwar Basin, Pakistan: 1. Oil–oil correlation using biomarkers, δ13C and δD,” Organic Geochemistry, Vol. 42, No. 10, November 2011, pp. 1226-1240.
Baker, D. M., Lillie, R. J., Yeats, R. S., Johnson, G. D., Yousuf, M., and Zamin, A. S. H., “Development of the Himalayan frontal thrust zone: Salt Range, Pakistan,” Geology, Vol. 16, No. 1, January 1988, pp. 3-7.
Bender, F. and Raza, H. A., “Geology of Pakistan,” Gebrüder Borntraeger, Berlin, 1995.
Bordenave, M.L., “Applied Petroleum Geochemistry,” Editions Technip, Paris, 1993.
Bordenave, M.L., Espitalié, L., Leplat, P., Oudin, J.L., and Vandenbroucke, M., “Screening techniques for source rock evaluation,” Applied Petroleum Geochemistry, Editions Technip, Paris, 1993, pp. 217–278.
Davis, D. M. and Lillie, R. J., “Changing mechanical response during continental collision: active examples from the foreland thrust belts of Pakistan,” Journal of Structural Geology, Vol. 16, No. 1, July 1994, pp. 21-34.
Oil and Gas Development Corporation (OGDC), “Pakistan petroleum prospects – An overview,” Oil and Gas Development Corp., Islamabad, Pakistan, 1996.
Espitalié, J., Laporte, J.L., Madec, M., Marquis, F., Leplat, P., Pauletand, J., and Boutefeu, A., “Methode rapide de caracterisation des roches meres, de leur potential petrolier et de leur degre d’evolution,” Revue de l’Institut Francais du Petrole, Vol. 32, No. 1, January-February 1977, pp. 23–42.
Fazeelat, T., Asif, M., Jalees, M. I., Saleem, A., Nazir, A., Saleem, H., and Nadeem, S., “Source correlation between biodegraded oil seeps and a commercial crude oil from the Punjab Basin,” Pakistan. Journal of Petroleum Science and Engineering, Vol. 77, No. 1, 2011, pp. 1-9.
Fazeelat, T., Jalees, M. I., and Bianchi, T. S., “Source rock potential of Eocene, Paleocene and Jurassic deposits in the subsurface of the Potwar Basin, northern Pakistan,” Journal of Petroleum Geology, Vol. 33, No. 1, January 2010, pp. 87-96.
Gansser, A. “The Himalayas—a fascinating geological challenge,” Episodes, Vol. 4, 1979, pp. 17-21.
Gansser, A., “The significance of the Himalayan suture zone,” Tectonophysics, Vol. 62, Vol. 1-2, February 1980, pp. 3743-4052.
Gee, E.R., “The age of the saline series of the Punjab and of Kohat,” Proceedings of the National Academy of Sciences, India, Section B, Vol. 14, 1945, pp. 269–310.
Gee, E.R., “Further note on the age of the saline series of the Punjab and of Kohat,” Proceedings of the National Academy of Sciences, India, Section B, Vol. 16, 1947, pp. 95–153.
Ghazi, S. and Mountney, N. P., “Subsurface Lithofacies Analysis of the Fluvial Early Permian Warchha Sandstone, Potwar Basin, Pakistan,” Journal of the Geological Society of India, Vol. 76, No. 5, November 2010.
Hasany, S. T. and Saleem, U., “An integrated subsurface geological and engineering study of Meyal field, Potwar plateau, Pakistan,” Search and Discovery Article, 20151, June 2012, pp. 1-41.
Hunt, J.M., “Petroleum Geochemistry and Geology,” W.H. Freeman, San Francisco, Second ed., 1996.
Ibrahim, S. M., “Stratigraphy of Pakistan,” Geological Survey of Pakistan, 2539, 2009.
Jadoon, I. A. and Frisch, W., “Hinterland-vergent tectonic wedge below the Riwat thrust, Himalayan foreland, Pakistan,” Implications for hydrocarbon exploration, AAPG bulletin, Vol. 81, No. 3, March 1997, pp. 438-448.
Jadoon, I.A.K., Frisch, W., Jaswal, T.M. and Kemal, A., “Triangle zone in the Himalayan Foreland, north Pakistan,” Special Paper of the Geological Society of America, Vol. 328, January 1999, pp. 275-286.
Jaswal, T. M., Lillie, R. J., and Lawrence, R. D., “Structure and evolution of the northern Potwar deformed zone, Pakistan,” AAPG bulletin, Vol. 81, No. 2, February 1997, pp. 308-328.
Kadri, I. B., “Petroleum geology of Pakistan,” Pakistan Petroleum Limited, Ferozsons (pvt) Ltd., 1995.
Kazmi, A. H. and Jan, M. Q., “Geology and tectonics of Pakistan”, Graphic publishers, Karachi, 1997.
Khan MA, Ahmed R, Raza HA, and Kemal A, “Geology of petroleum in Kohat-Potwar depression, Pakistan,” AAPG Bulletin, Vol. 70, No. 4, April 1986, pp. 396–414.
Killops, S.D. and Killops, V.J., “Introduction to Organic Geochemistry,” Blackwell Publishing, Second ed., 2005.
Memon, A. D. and Siddiqui, I., “Petroleum geology and hydrocarbon prospects of Sindh, Pakistan,” Hyderabad, Allah Dino Memon, Pakistan, First ed., 2005.
Mohadjer, S., Bendick, R., Ischuk, A., Kuzikov, S., Kostuk, A., Saydullaev, U., and Molnar, P., “Partitioning of India‐Eurasia convergence in the Pamir‐Hindu Kush from GPS measurements,” Geophysical Research Letters, Vol. 37, No. 4. February 2010.
Molnar, P., “A review of the seismicity and the rates of active underthrusting and deformation at the Himalaya,” Journal of Himalayan Geology, Vol. 1, No. 2, 1990, pp. 131-154.
Molnar, P. and Tapponnier, P., “A possible dependence of tectonic strength on the age of the crust in Asia,” Earth and Planetary Science Letters, Vol. 52, No. 1, January 1981, pp. 107-114.
Oil and Gas Development Corporation (OGDC), “Pakistan petroleum prospects – An overview,” Oil and Gas Development Corp, Islamabad, 1996.
Peters, K.E., “Guidelines for evaluating petroleum source rock using programmed pyrolysis,” AAPG bulletin, Vol. 70, No. 3, March 1986, pp. 318-329.
Peters, K.E. and Cassa, M.R., “Applied source rock geochemistry,” American Association of Petroleum Geologists memoir, vol. 60, 1994, pp. 93–120.
Quadri, V. U. N. and Quadri, S. M. G. J., “Anatomy of success in oil and gas exploration in Pakistan, 1915-94,” Oil and Gas Journal, Vol. 94, No. 20, May 1996.
Shah, S. B. A. and Abdullah, W. H., “Petrophysical properties and hydrocarbon potentiality of Balkassar well 7 in Balkassar oilfield, Potwar Plateau, Pakistan,” Bulletin of the Geological Society of Malaysia, Vol. 62, December 2016, pp. 73-77.
Shah, S. B. A. and Abdullah, W. H., “Structural interpretation and hydrocarbon potential of Balkassar oil field, eastern Potwar, Pakistan, using seismic 2D data and petrophysical analysis,” Journal of the Geological Society of India, Vol. 90, No. 3, September 2017, pp. 323-328.
Shah, S. B. A. and Ahmed, A., “Hydrocarbon source rock potential of Paleocene and Jurassic deposits in the Panjpir oilfield subsurface, Punjab Platform, Pakistan,” Arabian Journal of Geosciences, Vol. 11, No. 20, October 2018.
Shah, S. B. A., Abdullah, W. H, and Shuib, M. K., “Petrophysical properties evaluation of Balkassar oilfield, Potwar Plateau, Pakistan: implication for reservoir characterization,” Himalayan Geology, Vol. 40, No. 1, March 2019, pp. 50-57.
Shah, S. I., “Stratigraphy of Pakistan,” Memoirs of the Geological Survey of Pakistan, Vol 12, 1977.
Shah, S.B.A. and Ahmed, A., “Evaluation of Ranikot Sandstone Formation, Punjab Platform Basin Pakistan,” Journal of the Geological Society of India, Vol. 95, No. 4, April 2020, pp. 403–406.
Shami, B. A. and Baig, M. S., “Geomodeling for enhancement of hydrocarbon potential of Joya Mair Field (Potwar) Pakistan,” Pakistan Association of Petroleum Geoscientists-Society of Petroleum Engineers Annual Technical Conference, Islamabad, Nov. 2-4, 2002, pp. 124-145.
Teichmüller, M., Littke R., and Robert, P., “Coalification and maturation,” Organic Petrology, Gebrüder Borntraeger, Berlin, 1998, pp. 86–174.
Tissot, B.P. and Welte, D.H., “Petroleum Formation and Occurrence,” Springer, New York, Second Ed., 1984.
Killops, S. D. and Killops, V. J., “Introduction to organic geochemistry,” John Wiley & Sons., Blackwell Publishing Ltd., UK, Second ed., 2013.
Warwick, P. D. and Wardlaw, B. R., “Regional studies of the Potwar plateau area, northern Pakistan,” Bulletin 2078, US Geological Survey, 2007.
Zahid, M., Khan, A., Rashid, M., Saboor, A., and Ahmad, S. “Structural interpretation of Joya Mair oil field, south Potwar, Upper Indus Basin, Pakistan, using 2D seismic data and petrophysical analysis,” Journal of Himalayan Earth Sciences, Vol. 47, No. 1, May 2014, pp. 73-86.
Author
Dr. Syed Bilawal Ali Shah is a visiting faculty assistant professor at Bahria University, Islamabad, Pakistan. He has an MS (2017) and PhD (2019) in petroleum geology from the University of Malaya, Malaysia. He is a member of the Geological Society of Malaysia.