Oil market to be relatively balanced amid heightened complexity in 2019
Following a sharp decline in oil prices and the Organization for Economic Cooperation and Development stocks returning above their 5-year average, the Organization of Petroleum Exporting Countries and 10 non-OPEC producers agreed to cut production by 1.2 million b/d relative to October 2018 levels for 6 months beginning on Jan. 1. OPEC is responsible for 800,000 b/d of cuts while non-OPEC accounts for the remaining 400,000 b/d.
Given these cuts, along with additional output curtailments in Canada and involuntary declines in some other regions, the global oil market in 2019 may go some way towards restoring balance.
US shale production will continue to rise in 2019, benefiting from these production cuts. But infrastructure constraints are putting a cap on production growth in the near term, which is unlikely to be fully alleviated until this year’s fourth quarter as more takeaway capacity is built.
Nevertheless, the range of outcomes of the 2019 oil market is wide amid heightened complexity including trade tensions, interest rate normalization, global economic deceleration, and the expiration of the Iranian export waivers.
Given the decelerating global economic growth and price elastic tailwinds associated with lower oil prices, global oil demand growth is a prominent wildcard moving forward.
Global economy
The global economy is poised to slow down moderately from 2018 to 2019 amid uncertainty about trade tensions and tighter monetary policies. Both advanced and emerging economies will find it hard to extend their recent robust economic performance into this year.
The possibility of escalation of global trade tensions remains high. In the case of a global increase in tariffs, higher import prices could increase firms’ production costs and reduce households’ purchasing power. This could affect consumption, investment, and employment, and fuel economic uncertainty.
Eurozone growth, projected at 1.9% in 2018 and 2.4% in 2017, is set to ease to about 1.7% in 2019, amid trade tensions, Brexit uncertainty, Italy’s budget stand-off, strikes in France, and others. Nevertheless, the slowdown is likely to be gradual rather than abrupt, with domestic demand supported by tightening labor markets and rising wages.
UK growth should see an improvement in 2019, if Brexit goes smoothly. Japan’s growth is steady at 1% in 2018-19, as corporate profits remain high and labor shortage drives wage gains and private consumption.
The US economy maintained robust growth of 2.9% in 2018, buoyed by sizable fiscal stimulus from tax cuts and spending increases. The US Federal Reserve hiked rates four times in 2018, putting the Fed funds rate at 2.5%—the highest level since early 2008.
OGJ forecasts the US economy to expand by 2.5-2.7% in 2019, a slowdown from 2018’s pace. However, the growth is still solid and above the past 5-year average. Personal consumption should continue to be supported by tax cuts, high consumer confidence, and low oil prices. Government spending will keep its momentum in 2019. However, higher interest rates will moderate private business investment. Growth is expected to decline more markedly in 2020 when the fiscal stimulus begins to unwind.
China’s economic growth slowed quite a bit in 2018 to 6.6% from 6.9% in 2017 because of slower credit growth and rising trade war fears. The Chinese economy is expected to decelerate to 6.2% in 2019 for both structural and trade-related reasons. If the trade war escalates further, a sub-6% real gross domestic product growth is possible.
The Indian economy, which expanded 7.4% in 2018, will slow to 7.3% in 2019 due to rising interest rates.
On the currency side, many currencies weakened against the US dollar in 2018 due to trade tensions, other risks, and tightening by the Fed. The combination of a peak in US rates and the start of tighter monetary policies elsewhere might result in a weaker US dollar in 2019, which would support oil demand.
Global oil demand
Impacted by higher oil prices and weaker local currencies, oil demand growth in 2018 averaged 1.3 million b/d, down from 1.6 million b/d in 2017, according to the latest figures from the International Energy Agency.
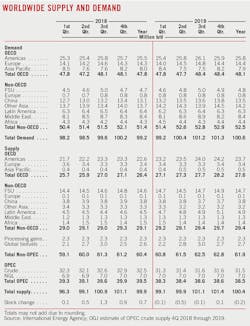
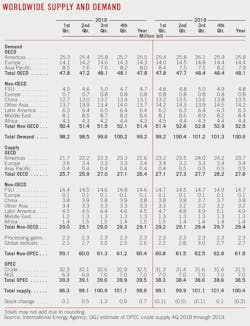
IEA forecasts that global oil demand will climb 1.4 million b/d to average 100.6 million b/d this year, led by developing countries. The 2019 oil demand will be supported by lower prices (implied by a downward-sloping forward curve) and a weaker US dollar. Downside risks to the demand forecast include lower economic growth and continued weak currencies in some countries.
Total OECD demand grew 0.8% in 2018 to 47.8 million b/d, following a growth of 1% in 2017. US demand in 2018 continued to be robust, supported by new petrochemical projects and strong industrial activity. Demand in OECD European and Asian countries were down, impacted by higher oil prices and a slowdown in economic activity.
IEA forecasts this year’s OECD oil demand will increase by a smaller margin of 0.6%. Total OECD demand growth is expected to slow to 290,000 b/d in 2019 from 380,000 b/d in 2018 and from 450,000 b/d in 2017.
Demand in OECD Americas’ oil demand will grow 1% this year, following a nearly 2% increase in 2018. The growth will ease to 235,000 b/d from 480,000 b/d in 2018. A large part of the increase in 2019 will come from LPG and ethane. Gasoline demand should recover on lower prices, after a weak 2018.
OECD European countries’ oil demand will grow 0.8% to 14.42 million b/d this year from last year’s 14.29 million b/d, while demand in Japan will decline by about 60,000 b/d to 3.74 million b/d.
Non-OECD demand is projected to increase by 895,000 b/d in 2018, and by 1.1 million b/d in 2019, with Asia contributing 880,000 b/d and 905,000 b/d, respectively. China and India are, as always, the main sources of growth.
Oil demand growth in China in 2019 will be slower, but still substantial. Oil demand is expected to average 13.5 million b/d in 2019, up from 13.1 million b/d in 2018 and 12.6 million b/d in 2017, driven by gains in demand for all major categories.
Indian oil demand in second-half 2018 was hit by higher oil prices and the falling value of the rupee vs. the US dollar. Overall, Indian oil demand is projected to grow by 245,000 b/d to 4.8 million b/d in 2018. The pace of growth will be similar in 2019, according to IEA.
Middle East demand for oil will average 8.45 million b/d in 2019, up from the 2018 average of 8.39 million b/d. Oil demand will decrease by 80,000 b/d in Latin America this year, reflecting collapsing demand in Venezuela.
Worldwide oil supply
Liquids production of the world’s largest three producers—Russia, Saudi Arabia, and the US—now comprises about 40% of the world’s total. Cooperation between Russia and Saudi Arabia is the basis of current production management as these two countries have a large capacity to swing output. Their cooperation aims to influence oil prices and release stress on their budgets. The US is now the world’s biggest crude oil producer, but its production management is at company level and producers are price takers.
Despite the highly volatile evolving dynamics within the cartel (e.g., Qatar, an OPEC member since 1961, left the group on Jan. 1 to focus on natural gas), OPEC was largely successful in holding 2018 production levels flat vs. 2017. The increase in production from Saudi Arabia, Libya, and Iraq offset declines in Angola, Iran, and Venezuela.
OPEC crude production in 2019 will be governed by voluntary and involuntary cuts. Saudi Arabia said it will reduce its output by more than required under the deal. Production is expected to drop to 10.2 million b/d in January, down from an anticipated 10.7 million b/d in December and vs. record rates above 11 million b/d in November, according to Saudi Energy Minister Khalid al-Falih. The UAE also has signaled the start of curbed supply in December.
Iran, Venezuela, and Libya are exempt from the cut agreement. However, declines from Iran and Venezuela will continue in 2019. Iran will likely see a sharp fall in production of more than 500,000 b/d between October and this year’s first half due to US sanctions. Venezuela’s production will likely decline another 200,000 b/d over the period due to lack of investment. Meanwhile, Libyan production remains at risk due to instability in the region with 400,000 b/d currently offline. So, involuntary production reduction of OPEC is non-trivial.
Following the output reduction pledge by 10 non-OPEC producers and as Alberta imposed mandatory output reductions, non-OPEC supply growth for 2019 is forecast at 1.5 million b/d, according to IEA. This follows a 2.4 million-b/d gain in 2018.
Russia agreed to cut production by 230,000 b/d from October’s record high of 11.4 million b/d in coming months. The remaining 170,000 b/d of non-OPEC cuts is to be proportionally divided between the remaining parties to the Vienna Agreement, which are Mexico, Oman, Kazakhstan, Azerbaijan, Malaysia, Bahrain, Brunei, Sudan, and South Sudan.
The record discounts for its crude and rising inventories has forced Canada to reduce its production. Alberta announced in December it would mandate temporary production cuts starting in January. The largest operators have been asked to curb output by 8.7%, or 325,000 b/d, for an initial 3 months to draw down the excess crude in storage, and 95,000 b/d thereafter until yearend.
After falling by 145,000 b/d during 2018, North Sea oil production is forecast to decline by a further 30,000 b/d during 2019, to 2.9 million b/d, with declines mostly coming from Norway while UK output holds steady, according to IEA.
The US shale players will benefit from these production cuts and reductions. However, infrastructure constraints and cautious capital spending brought by the recent price volatility should culminate in declining activity levels in 2019. US total oil production, including NGLs, is seen rising by 2.1 million b/d and 1.8 million b/d in 2018 and 2019, respectively, according to OGJ.
Brazilian oil supply in 2018 was lower than expected. But the country’s production is forecast to rise markedly in 2019 thanks to output gains from new projects.
Stocks
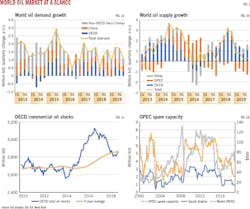
OECD commercial stocks rose for the fourth straight month in October—the latest data available—by 5.7 million bbl to reach 2,872 million bbl. They stood at their highest level since January and were for the first time in several months above the 5-year average, by 11 million bbl. NGL and feedstock inventories hit a historic high whereas fuel oil stocks fell to a record low.
Assuming IEA’s 2019 demand forecast and OPEC crude output of 31.5 million b/d for the year and the resulting total oil supply of 100.4 million b/d, then inventories would be drawn down by 200,000 b/d this year.
US oil demand
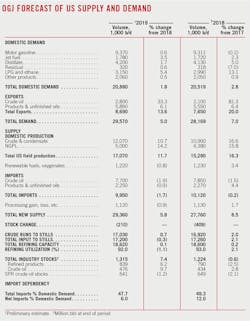
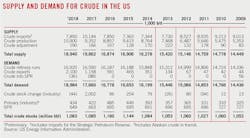
US petroleum demand averaged 20.5 million b/d in 2018, the highest since 2007. This was an increase of 500,000 b/d, or 2.8%, over 2017, with most petroleum categories being on the rise. The gains originated in the demand for distillate fuel, jet fuel, as well as LPG and ethane, partly offset by declines in gasoline, residual fuel oil, and naphtha consumption.
Total motor gasoline deliveries were estimated at 9.3 million b/d in 2018, which was a slight decrease of 0.2% from 2017, due to higher retail prices and increasingly subdued vehicle sale statistics. National average prices for retail gasoline were close to $3/gal for most of the summer last year compared with $2.50/gal in the summer of 2017.
In 2018, distillate consumption of 4.13 million b/d increased 5% compared with 2017 and was the highest since 2007. Much of distillate demand was for ultralow-sulfur diesel, driven by road freight transportation activity. Transport by trucks is increasing strongly, reflecting growth in robust industrial production and booming shale oil production. In addition, trucks are used to move crude oil out of the producing areas due to bottlenecks in pipeline capacities.
Jet fuel demand growth has remained solid. In 2018, jet fuel demand averaged 1.72 million b/d, the highest on record. In its latest report, the International Air Transport Association reported US air passenger kilometers increased by 6.2% in 2018 compared with 2017.
Demand for LPG and ethane, which are used for heating and petrochemical feedstock, rose strongly, reflecting cold weather at the start of the year, the start-up of petrochemicals projects, and a weak historical baseline in 2017 because of Hurricane Harvey.
Residual fuel oil consumption was 318,000 b/d in 2018, a decrease of 7% from 2017 and the lowest since 2015. The pattern of monthly changes of residual fuel oil demand in 2018 was the most volatile on record, consistent with the marine shipping-driven activity.
OGJ forecasts that US oil demand will continue rise in 2019, in line with sustained economic growth outlook. Demand for jet fuel, distillate, LPG, and ethane continue to grow strongly. Gasoline demand will also recover on lower prices. Upside risks of oil demand growth relate to the development of the overall economy and the price environment, while downside risks concern the economy, fuel substitution, vehicle efficiencies, and the high baseline seen in oil demand seen last year.
US oil production
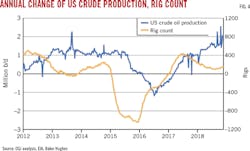
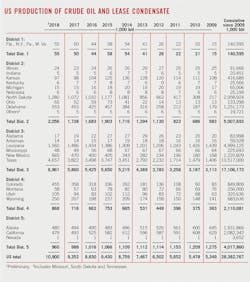
US crude oil production averaged 10.9 million b/d in 2018, a 16.6% increase from 2017. In 2018, more than 55% of total crude oil output in US, at an average of 6 million b/d, came from shale plays, mainly from the Permian basin, which amounted to about 2.7 million b/d, according to preliminary data.
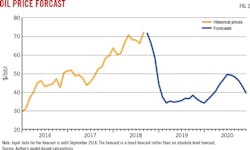
In 2019, the US shale players will benefit from production cuts elsewhere. The US has displayed its explosive growth potential in a $60/bbl West Texas Intermediate environment and remains capable of delivering strong production growth in a low-$50/bbl WTI environment given efficiency gains and service deflationary tailwinds. In the near term, however, it is infrastructure constraints that will limit supply growth. The recent price volatility also has brought more uncertainty into the E&P spending outlook.
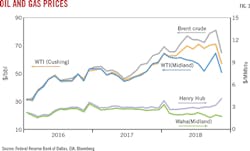
In fourth-quarter 2018, total output at the Permian basin including conventional oil reached 3.7 million b/d, exceeding pipeline capacity in the region, leading to a wider discount between WTI Cushing and WTI Midland. The earlier-than-expected commissioning of Plains All American’s Sunrise pipeline in November 2018 proved relief to the basin. However, takeaway capacity remains tight until this year’s second half, when 1.8 million b/d of additional capacity will put an end to pipeline shortages in the Permian.
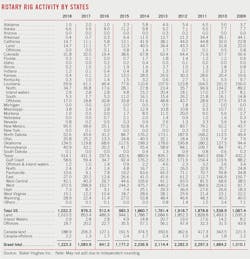
Drilled uncompleted wells have been steadily climbing for the Permian, as producers defer production until new takeaway capacity in place becomes available. Some are moving rigs to other plays such as the Bakken and Eagle Ford.
In the Bakken shale formation of North Dakota, takeaway pipeline capacity also is lacking for the first time since 2013, despite the commissioning of Energy Transfer Partners’ 525,000-b/d Dakota Access line in 2017. No substantial pipeline buildout is planned in the region until at least 2020. Rail usage will rise instead.
The recent crude oil price volatility is causing more uncertainties about the exploration and production spending outlook in 2019. Investors have been pushing companies to generate higher profits instead of increasing production, worrying a further drop in oil prices could have slashed cash flow needed to cover production costs and deliver shareholder dividends.
The Gulf of Mexico is expected to see crude production growth in 2019, primarily driven by new projects coming online. US crude oil production also is seen rising 1 million b/d in 2019 compared with 1.6 million b/d in 2018, according to OGJ.
US natural gas liquids production increased 15.8% in 2018 to 4.38 million b/d and will increase 14% to 5 million b/d this year, OGJ forecasts. Growth of 2.1 million b/d for US total oil supply in 2018 is expected to slow to 1.8 million b/d in 2019.
US oil trade
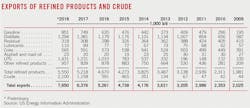
The US exported 7.65 million b/d of crude oil and petroleum products in 2018, the largest annual amount ever. This compares with 6.37 million b/d in 2017. According to the US Energy Information Administration, in the week ended Nov. 30 the US was a net exporter of crude and products for the first time since at least 1991.
Crude oil surpassed hydrocarbon gas liquids (HGL) to become the largest US petroleum export in 2018. US crude oil exports increased 81% from 2017 to 2018 and set a new record of 2.1 million b/d, according to OGJ’s estimate.
Most US crude went to markets in Asia and Oceania such as China, South Korea, and India. Europe was the second-largest market for US crude oil exports, led by Italy, the UK, and the Netherlands. Exports to Canada for the first 9 months of 2018 was down slightly compared with the same period of 2017.
The latest data on country-specific shifts through October 2018 showed China purchased no US crude oil for the third consecutive month. However, Mexico, Brazil, South Korea, Canada, Chile, and India picked up the slack by increasing their US petroleum purchases between September and October.
HGLs—including propane, ethane, butanes, and natural gasoline—were the second-largest petroleum export from US in 2018 at 1.6 million b/d, a 14% increase from 2017. With local expanded petrochemical facilities, Asia and Oceania such as Japan, South Korea, China, and India were also the primary recipients of US HGLs.
Due to lower exports to many destinations in Central and South America and in Europe, US distillate exports for the first 9 months of 2018 declined 7% compared with the same period of 2017. However, the decline might have reversed since October according to preliminary EIA data. Compared with other petroleum exports, US distillate exports go to the most destinations.
Over the first 9 month of 2018, the US exported 840,000 b/d of motor gasoline in 2018, an increase of 23% compared with the same period of 2017. More than half of US motor gasoline exports went to Mexico in 2018, the largest to a single destination of any US petroleum export. Mexico has relatively low refinery utilization rates and in recent years has increased imports of motor gasoline and other petroleum products from the US.
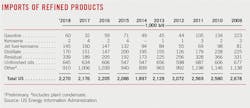
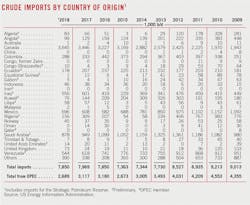
Crude imports, meanwhile, averaged 7.85 million b/d in 2018, down from the 2017 average of 7.97 million b/d, OGJ estimates. Product imports moved up 4.4% last year to average 2.27 million b/d.
The US imported more than 3.6 million b/d of crude from Canada in 2018, more than the combined imports from all of OPEC. And most of those imports, about 80%, are heavy oil. Crude imports from OPEC members decreased by 428,000 b/d, or 14%, from a year ago. Imports from Nigeria and Angola contributed to the largest declines.
Combined, in 2018, estimated US net imports of crude averaged 5.75 million b/d, down 15% from a year ago. US net imports of crude will continue to fall this year. Estimated US net exports of products averaged 3.3 million b/d last year, up 10% from a year ago, and will continue to grow this year. OGJ forecasts that US total exports will reach 8.7 million b/d in 2019, while total imports will decline to 9.9 million b/d.
Refining
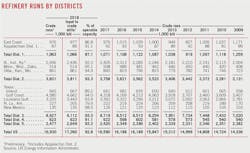
With access to notably discounted light and heavy barrels from the Permian, Bakken, and Canada, US refinery runs averaged 16.9 million b/d in 2018 and will likely average 17 million b/d in 2019, both surpassing the 2017 annual average of 16.6 million b/d. Strong demand and exports have helped keep demand for US product strong.
US refiners ran at a utilization rate of 93% in 2018 compared with 91% in 2017. Refining capacity of 2018 increased to 18.59 million b/d from 18.56 million b/d a year ago.
The record-high US input levels were driven in large part by refinery operations in the Gulf Coast and Midwest regions. The Gulf Coast (PADD 3) has more than half of all US refinery capacity and reached a new record input level of 9.14 million b/d in 2018. The Midwest (PADD 2) has the second-highest refinery capacity, and gross refinery inputs reached a record-high 3.83 million b/d for the year.
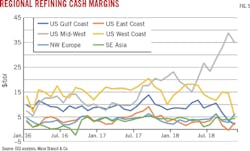
Refining cash margins for the first 11 months of 2018 averaged $25.87/bbl for the Midwest, $14.47/bbl for the West Coast, $8.23/bbl for the Gulf Coast, and $2.90/bbl for the East Coast, according to Muse Stancil & Co. The average cash refining margins for these refining centers averaged a respective $13.95/bbl, $16.59/bbl, $9.67/bbl, and $5.05/bbl in 2017.
Disconnected from the seaborne hubs, the US Midcontinent refiners enjoyed higher margins again, thanks to the discounted US inland and Canadian grades. These refineries enjoy some of the lowest feedstock costs, while product prices tend to be at a premium to other regions, too.
Higher gasoline prices in 2018 contributed to flattening US gasoline demand growth. Since August 2018, flattening growth in US gasoline demand, combined with high levels of refinery output and higher imports, have contributed to high gasoline inventory levels and low or negative motor gasoline refining margins for refiners along the East and Gulf Coasts.
In contrast, distillate crack spreads remain robust with high domestic and export demand. In 2020 the International Maritime Organization will require ships to use fuels with a maximum sulfur content of 0.5% (reduced from 3.5% currently). The change will continue to strengthen distillate cracks while widen high sulfur fuel oil discounts. Meantime, sour crude oil discounts are expected to widen as low complexity refineries switch to sweeter crude and feedstocks.
US oil inventories
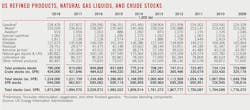
Stock of crude and products finished last year 0.6% lower than a year earlier. Yearend crude inventories, excluding the Strategic Petroleum Reserve, were up 2.8%. Total product stocks at yearend 2018 were down 2.5%. Inventories of distillate were down 8%, reflecting rising distillate demand and strong exports.
The amount of crude oil in the SPR stood at 649 million bbl at yearend 2018 compared with 663 million bbl at yearend 2017, as the US Department of Energy sold further volumes.
US natural gas
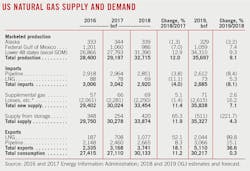
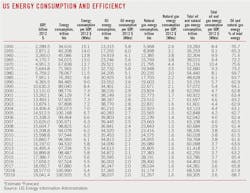
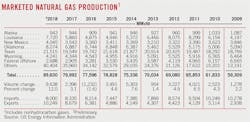
Last year was one of weather extremes in the US, including the coldest April in 35 years, the hottest May-September on record, and the first colder-than-normal October in 9 years. According to OGJ’s estimate, US natural gas consumption averaged 82.56 bcfd during 2018, up 11% from a year earlier. Gas consumption increased in all major categories.
Colder winter weather at the beginning of 2018 drove up residential and commercial heating demand for gas, which combinedly increased 10% from the 2017 level.
Power plants used 14% more gas during 2018 compared with a year ago, as economics of gas generation became more favorable, due to higher-than-expected delivered coal price. Gas consumption in the electric power sector also increased with the buildout of gas-fired power plants as well as coal plant retirement. The strong demand has also been supported by extreme weather.
Industrial consumption of gas in US was 1 bcfd, or 4% higher, in 2018 compared with 2017. Industrial consumption of gas is affected by weather-related space-heating needs, particularly in the Northeast and Midwest.
US gas consumption growth in 2019 is forecast to slow, as winter 2018-19 is forecast to be less cold than last winter.
US gas production growth from both shale gas and associated gas has exceeded expectations. Strong volumes from Appalachia, the Permian, and Haynesville led to a nearly 11% increase in gas production year-over-year.
The additional pipeline capacity brought into service since June 2017 has enabled production increases, including the Leach XPress, the Rover Pipeline, and Phase 1 of Atlantic Sunrise, all of which transport gas out of the US Northeast region. However, the West Texas Waha hub is constrained by pipeline capacity, leading to discounted Waha prices.
Gas production in the Gulf of Mexico has been declining for decades. However, eighteen new fields that started production in 2018 or will start production this year will slow or reverse the long-term decline.
With production outpacing domestic consumption, the US—which became a net gas exporter on an annual basis in 2017 for the first time in almost 60 years—has continued to export more gas than it imports.
In 2018, US LNG exports, which mostly go to countries in Asia, and pipeline exports, which go to Mexico and Canada, collectively increased by 1.6 bcfd, or 18%, from the 2017 level.
US LNG exports through 2018 rose 52% from 2017, averaging 2.95 bcfd. The global supply glut of LNG caused by the newly commissioned US and Australian trains was quickly being absorbed by the fast growth of global demand, most notably in China and India.
The increase in US LNG exports also was accompanied with the addition of LNG export facilities in the Lower 48 states. The LNG facility at Sabine Pass in Louisiana has an export capacity of 2.8 bcfd, which includes the recently completed Train 4. Cove Point LNG in Maryland has an export capacity of 0.8 bcfd. Another four LNG facilities are under construction and planned to enter into service by yearend, ultimately increasing total US LNG export capacity to 9.6 bcfd.
Exports by pipeline to Mexico rose in 2018, while exports by pipeline to Canada declined. Most of this decline occurred in deliveries from St. Clair, Mich., to the Dawn hub in Ontario.
Overall, consumption and exports increased 2.7 bcfd more than production and imports in 2018, which prompted withdrawals of gas from storage. Relatively high net withdrawals and low net injections in 2018 have resulted in inventories at the end of October 18% lower than the previous 5-year average.
In the past, relatively low gas inventories have coincided with relatively high prices, but recent changes in US gas markets have kept prices relatively low and stable. The steady increase in US production in 2018 has suppressed gas futures market prices, despite record consumption of gas in the electric power sector this past summer and increasing US exports of LNG. Also, the buildup of pipelines, efficiently connecting production areas and consumption markets, reduce the need for storage.
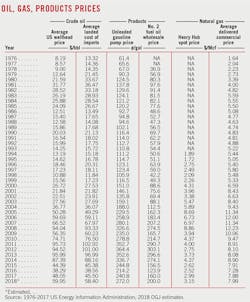
Spot gas prices at Henry Hub were estimated to average $3.15/MMbtu in 2018, slightly higher than in 2017.
About the Author
Conglin Xu
Managing Editor-Economics
Conglin Xu, Managing Editor-Economics, covers worldwide oil and gas market developments and macroeconomic factors, conducts analytical economic and financial research, generates estimates and forecasts, and compiles production and reserves statistics for Oil & Gas Journal. She joined OGJ in 2012 as Senior Economics Editor.
Xu holds a PhD in International Economics from the University of California at Santa Cruz. She was a Short-term Consultant at the World Bank and Summer Intern at the International Monetary Fund.
Laura Bell-Hammer
Statistics Editor
Laura Bell-Hammer is the Statistics Editor for Oil & Gas Journal, where she has led the publication’s global data coverage and analytical reporting for more than three decades. She previously served as OGJ’s Survey Editor and had contributed to Oil & Gas Financial Journal before publication ceased in 2017. Before joining OGJ, she developed her industry foundation at Vintage Petroleum in Tulsa. Laura is a graduate of Oklahoma State University with a Bachelor of Science in Business Administration.
