US ethane demand finally surges
Dan Lippe
Petral Consulting Co.
Houston
Following delays caused by Hurricane Harvey’s disruption to midstream infrastructure, NGL demand in the ethylene and refinery feedstock markets, and US NGL waterborne exports, the long-anticipated rise in US ethane demand has finally arrived, and with additional plants on track for startup, shows little indication of soon slowing down.
Before Harvey’s landfall in late August 2017, gas processors anticipated that startup of two or three new ethane-only ethylene plants on the Upper Texas Coast (Corpus Christi to Beaumont-Port Arthur) would lead to a 250,000-300,000 b/d jump in ethane demand. Instead, as ethylene producers in the Upper Texas Coast repaired Harvey’s damage, the beginning of an historic surge in ethane demand was delayed until February-March 2018. The surge in ethane demand will extend into mid-to-late 2019 depending on when the last new ethane-only plants reach startup.
Consistent with the emphasis on previously projected rising US ethylene production, this article focuses on rising ethane demand and its impact on gas plant ethane recovery in low and high-cost regions.
NGL raw-mix production
Crude oil and associated gas production have been the primary drivers for gas plant NGL production in the US Gulf Coast (USGC), Midcontinent, and Rocky Mountain regions since 2012. When oil prices entered a period of free fall in October 2014, the number of drilling rigs in oil-directed service also fell sharply. To the surprise of many, US oil exploration companies responded to the nascent recovery in crude oil prices by increasing oil-directed drilling activity in second-half 2016.
According to detailed statistics from Baker Hughes, the rig count for oil-directed drilling began to rebound in third-quarter 2016 and increased for five consecutive quarters (total US basis). After a modest decline in fourth-quarter 2017, the oil-directed rig count topped 800 in late March-early April 2018. More importantly, from the midstream industry’s perspective, the number of drilling rigs in oil-directed service in the Permian basin (West Texas, eastern New Mexico) increased for seven consecutive quarters (third-quarter 2016 through first-quarter 2018). According to Baker Hughes, the oil-directed rig count in the Permian basin averaged 427 in first-quarter 2018, 77% of the basin’s peak rig count in third-quarter 2014 and 206% of the rig count in second-quarter 2016 (the low point following the October 2014 collapse in oil prices).
During the oil-price downturn, oil exploration companies stacked 75-80% of rigs active in third-quarter 2014. As the number of stacked rigs increased to a peak of about 1,600, the number of wells drilled fell 60-65% in most oil-prone basins. Drilling contractors and oil service companies responded by sharply reducing their field crews.
As drilling activity recovered, oil service companies have been unable to meet the surge in demand for completion work. Based on favorable economics, however, oil exploration companies continued to drill new wells, increasing the backlog of drilled but uncompleted (DUC) wells. As oil service companies add to staff over the next few years, DUC wells will contribute to accelerated growth in US crude oil production.
Texas has been the focal point of the current renaissance in oil-directed drilling. The US Energy Information Administration (EIA) reported the backlog of DUC wells in Texas (Permian, Eagle Ford basins) was 4,245 in December 2017 vs. 3,100 wells in April 2017 and only 2,000-2,100 in fourth-quarter 2014. Even if the rig count in Texas remains constant or declines in second-half 2018, therefore, crude oil production in Texas-New Mexico will continue rising for the next 18-24 months. Based on an average oil production per new well of 450 b/d, the current DUC backlog alone will increase oil production in Texas-New Mexico by 2 million b/d.
Despite the 2015-16 downturn in crude oil production, gas plant NGL production has increased annually for 12 years, reaching the 3-million b/d milestone in late 2014. If gas plants had been called on to operate at full-ethane recovery mode, gas plant NGL production would have reached 4 million b/d in 2015. Based on actual ethane recovery, US gas processors produced 3.74 million b/d in 2017, 2.03 million b/d (116%) more than in 2005. If all gas plants had operated in full-ethane recovery mode, 2017 production would have averaged 4.34 million b/d, or 2.63 million b/d (154%) more than in 2005. In 2017, US crude production was 9.32 million b/d, 4.2 million b/d (82%) higher than 2005.
NGL production increased more than crude production because associated gas production (NGL-rich gas) replaced a large fraction of nonassociated gas-plant inputs, particularly in New Mexico, Texas, Kansas, and Oklahoma. Petral Consulting Co.’s analysis of gas plant throughput data for 2005-16 shows associated natural gas accounted for 18-20% of gas plant throughput for USGC gas plants in 2006-10. In 2014, associated gas throughput jumped to 55%, maintaining that level through 2015-16.
Total USGC gas plant throughput rates were 20 bcfd in 2005, 21 bcfd in 2010, and 24-26 bcfd in 2014-16, with USGC gas plants processing 3.5-4.0 bcfd of associated gas in 2005-11. Associated gas throughput rates had risen to 13-14 bcfd by 2014-16.
Petral Consulting estimates USGC NGL-recovery factors for associated gas were 4.9 gpm, with NGL content of associated gas three times more than that of nonassociated gas. Petral Consulting’s long-term forecast models explicitly account for growth in crude oil and associated gas production as key drivers for gas plant NGL production. By 2023-25, associated gas throughput rates will reach 20-22 bcfd to account for 75-80% of total gas plant throughput, while nonassociated gas throughput will fall to 5-7 bcfd from 13-14 bcfd in 2017 and 15-17 bcfd in 2005-12.
Regional trends
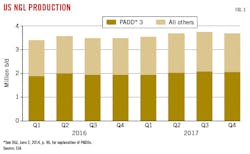
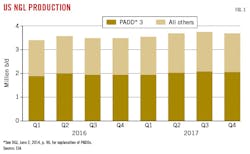
According to EIA statistics, US gas plant NGL production was 3.85 million b/d in second-half 2017 (Fig. 1). Production in third-quarter 2017 was 253,600 b/d more than same-period 2016, with year-over-year growth rising to 494,000 b/d in fourth-quarter 2017. Production of propane and heavy components was 2.38 million b/d in third-quarter 2017 and 2.43 million b/d in the fourth quarter, with year-over-year increases of 97,800 b/d for the third quarter and 220,200 b/d in the fourth quarter. The differences in year-over-year growth for full-NGL raw mix vs. propane+ resulted from a temporary jump in ethane recovery as prices rose to levels that supported full recovery by most gas plants in New Mexico and Texas. After a few months, prices were again too low to support full recovery.
Table 1 summarizes quarterly trends in US gas plant NGL production through fourth-quarter 2017.
During second-half 2018 through yearend 2019, growth in feedstock demand will drive ethane production ever higher until all gas plants in low-cost regions return to full-ethane recovery. Petral Consulting’s forecasts for 2018-20, however, are predicated on continuation of ethane rejection in high-cost regions. Petral Consulting determines which regions are considered low-cost and high-cost by developing a matrix of delivered costs from all producing regions to a common supply hub (Mont Belvieu, Tex.). The cost of raw-mix pipeline transportation to the Upper Texas Coast is the key variable determining whether any given gas plant is a low-cost or high-cost ethane supply source.
In third-quarter 2017, ethane production was 1.34 million b/d, or 47,600 b/d less than in second-quarter 2017 but 155,800 b/d more than in third-quarter 2016. Organic growth in gas plant throughput rates contributed to an increase in ethane production to 1.56 million b/d in fourth-quarter 2017, 273,800 b/d higher from fourth-quarter 2016.
Petral Consulting estimates ethane rejection by analysis of reported ethane recovery, propane+ recovery, NGL mix composition, and comparison with raw-mix composition when all gas plants in core production regions (USGC, Midcontinent, and Rocky Mountains) operated in full-ethane recovery mode (first-quarter 2012). Petral Consulting also recognizes an industry phenomenon known as maximum-ethane recovery creep, which occurs because gas processors generally use state-of-the-art turboexpander technology when they design and build new gas plants. Petral Consulting’s previous comprehensive studies of all gas processing plants have confirmed full-ethane recovery creep occurs but at a relatively slow pace, as gas processors are reluctant to shut down old plants even as they build new ones.
This article presents estimates of ethane rejection for four regions, including the USGC (PADD 3), Kansas-Oklahoma, other Midcontinent (other PADD 2), and all others (Rocky Mountains, East Coast). During second-half 2016 through fourth-quarter 2017, ethane rejection varied within a range of 500,000-675,000 b/d to average 580,000 b/d.
Low-cost ethane supply sources include all gas plants in PADD 3 (Louisiana, New Mexico, Texas) and the southern tier of PADD 2 (Kansas, Oklahoma). High-cost ethane supply sources include all gas plants in the East Coast or PADD 1 (Pennsylvania, West Virginia); the northern tier of PADD 2 (North Dakota, Ohio); and PADD 4 (all states in the Rocky Mountains).
Ethane-recovery costs are a function of three elements, the largest single element of which involves shrinkage. When a gas plant recovers ethane from its inlet natural gas stream, the volume and BTU content of the inlet natural gas shrink. Many contracts between gas processing companies and gas producers require producers to be compensated for the BTU shrinkage that occurs during gas processing. For an inlet natural gas price of $2.50/MMbtu, ethane’s shrinkage cost is 16.5¢/gal. Shrinkage costs vary from region to region but fall within a range of 13-17¢/gal.
The other elements of cost include pipeline transportation and merchant fractionation. For the purposes of this article, all fractionation fees in the Upper Texas Coast are deemed to be 6¢/gal and make no contribution to variations in overall ethane-recovery costs within the region. Pipeline transportation costs for delivery of NGL raw mix to the Upper Texas Coast, however, vary widely depending on distance. Tariffs also vary within a region. The sum of all three cost elements determines full-ethane recovery costs for nonintegrated gas plant operating companies.
A network of old and new pipelines originating in West Texas or South Texas deliver NGL raw mix to merchant fractionation sites in the Upper Texas Coast. Tariffs on new pipelines are generally higher than for old pipelines that originate in the same areas.
Gas plants in New Mexico and West Texas deliver ethane as a component of NGL raw mix via the network of old and new raw-mix pipelines to merchant fractionation sites in the Upper Texas Coast. Tariffs for old pipelines (those in service before 2007) are 2-3¢/gal, while tariffs for new pipelines (those that began operating after 2007) are 5-6¢/gal.
Gas plants in South Texas (Eagle Ford) deliver NGL raw mix to Mont Belvieu strictly via new pipelines. Gas plants in Louisiana deliver raw mix to one of several raw-mix fractionators in southern Louisiana via a network of intrastate raw-mix pipelines. Petral Consulting estimates tariffs for these raw-mix pipelines are 2-3¢/gal.
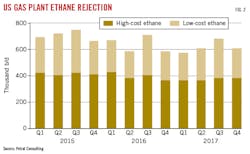
USGC ethane rejection varied within a range of 100,000-150,000 b/d for four of the six quarters second-half 2016 through fourth-quarter 2017, reaching a low of 69,000 b/d in fourth-quarter 2016 and a high of 212,000 b/d in third-quarter 2017. Gas plants in New Mexico and Texas accounted for 89-91% of total PADD 3 ethane production and 92-95% of ethane rejection in second-half 2017 (Fig. 2).
Based on actual inlet natural gas prices for the various regions and estimates of transportation and fractionation fees, Petral Consulting estimates gas plants in low-cost regions had ethane recovery costs of 24-28¢/gal in second-half 2017. Ethane recovery costs in the Rocky Mountains were 32-35¢/gal and those in the Bakken and Utica-Marcellus, 45-58¢/gal. Ethane rejection in low-cost regions was 275,000-300,000 b/d in 2015 and 225,000-250,000 in 2016-17. Rejection in high-cost regions was 400,000-440,000 b/d in 2015 and 350,000-420,000 b/d in 2016-17 (Table 2).
Compared with estimated recovery costs based on published pipeline tariffs and term contracts for fractionation, ethane-recovery costs for partially integrated or fully integrated midstream companies are at least 2-5¢/gal less for USGC plants and 5-8¢/gal less than in the Rocky Mountains. Petral Consulting estimates breakeven prices for gas plants operated by fully integrated midstream companies (those companies with ownership of raw-mix pipelines and fractionation-storage installations) of 22-23¢/gal in New Mexico, Texas, and Louisiana, and 24-27¢/gal for gas plants in the Rocky Mountains.
Transportation costs from gas plants in Marcellus-Utica via Enterprise Products Partners LP’s Appalachia-to-Texas Express (ATEX) pipeline are 15-20¢/gal. To qualify for transportation fees of 15¢/gal, gas processors and producers had to sign long-term take-or-pay agreements.
In analyzing ethane-rejection economics, Petral Consulting treats transportation costs for this class of shipper as a fixed cost. Ethane-recovery costs and rejection economics are based on variable costs. For shippers who signed take-or-pay agreements for both pipeline transportation and fractionation services, ethane recovery for gas plants in Marcellus-Utica has been economic since 2014. Consistent with positive recovery margins, ethane production in the Marcellus-Utica was 84,000 b/d in 2015 before increasing to 202,000 b/d in 2017.
For those companies who declined to sign take-or-pay agreements, ethane-recovery margins were -20¢/gal to -24¢/gal in 2014-16 and -18¢/gal in 2017. These producers were responsible for ethane rejection. Petral Consulting estimates rejection for gas plants in Marcellus-Utica was 150,000-175,000 b/d. Ethane rejection was 22% of estimated full-ethane recovery for Utica (Ohio) gas plants and 28% for Marcellus (Pennsylvania, West Virginia) gas plants. Total ethane rejection from all high-cost supply sources (including plants in North Dakota) was 360,000-380,000 b/d in 2017. This layer of potential ethane supply will remain unrecovered until purity-ethane prices in Mont Belvieu reach 45-50¢/gal or gas processors negotiate less expensive transportation contracts for ethane delivery to the Upper Texas Coast.
NGL market overview
Three markets account for more than 90% of US NGL demand:
• Petrochemical feedstock.
• Gasoline blending.
• Retail space heating and internal combustion.
All five NGL components are used as feedstock in petrochemical production, and normal butane, isobutene, and natural gasoline are used in gasoline blending. Retail space heating and internal combustion-engine markets, however, consume only propane. Of the three primary domestic end-use markets, only the petrochemical industry has the potential to considerably increase domestic NGL consumption. During 2017-19, petrochemical companies will start more than 15 billion lb/year of new ethylene capacity based on primarily purity-ethane feedstock. In most new plants, ethane will be the only feedstock. This article, with its primary focus on ethane, presents a discussion of trends in ethane demand in the ethylene feedstock market.
Petrochemical feedstock demand
Ethane’s only major end use is as feedstock for ethylene production. US ethylene capacity at yearend 2017 was 69 billion lb/year. Each US plant fits into one of three categories: no feedstock flexibility, limited feedstock flexibility, and extensive feedstock flexibility. Eight US ethylene plants have no practical feedstock flexibility and are included in the ethane-only category. These plants have a combined capacity of 9.9 billion lb/year. The second category includes all plants equipped to use ethane, propane, and normal butane, with some practical feedstock flexibility. US ethylene producers operate 13 plants in the LPG plant category with a combined capacity of 18 billion lb/year. The third category includes all multifeed plants, and US ethylene producers operate 17 plants in this category with a combined capacity of 41.2 billion lb/year.
Petral Consulting determines monthly ethylene production and feedstock demand by conducting an independent monthly survey of plant operating rates and feedslates to track consumption of purity ethane, ethane-propane mix, ethane and propane contained in refinery off gas, purity propane (HD5), normal butane, natural gasoline, refinery-sourced naphtha, and gas oil.
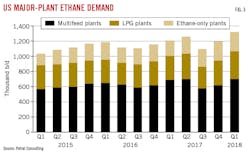
Ethylene producers consumed 1.54 million b/d of NGL feeds (ethane, propane, normal butane, and natural gasoline) in fourth-quarter 2017 and 1.72 million b/d in first-quarter 2018 (Fig. 3). NGL feeds accounted for 96% of total fresh feed in fourth-quarter 2017 and 97% in first-quarter 2018. Fourth-quarter 2017 demand was 29,300 b/d more than in third-quarter 2017. The quarterly increase in ethylene production in first-quarter 2018 (15 million lb/day) was the primary reason for the increase in NGL feed demand.
Ethane demand was 1.2 million b/d in fourth-quarter 2017 before increasing to 1.32 million b/d in first-quarter 2018. Ethane (purity ethane, ethane contained in ethane-propane mix, and ethane in refinery off gas) accounted for 78% of NGL feedstock demand in fourth-quarter 2017 and 77% in first-quarter 2018, with ethane demand in first-quarter 2018 setting a record high on a monthly and quarterly volume basis (Table 3). As the second and third new ethane-only plants start up in second and third-quarter 2018, ethane demand will increase to 1.60-1.65 million b/d in fourth-quarter 2018 and 1.65-1.70 million b/d in first-half 2019.
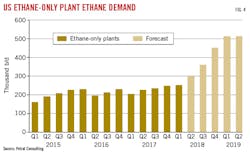
Fig. 4 shows estimated US ethane-only plant demand through first-half 2019.
Ethane exports
Before 2013, US producers exported no ethane. When midstream companies developed the first two ethane pipelines dedicated to transporting supply to ethylene plants in Sarnia, Ont., and Joffre, Alta., ethane exports began a period of steady growth. Exports via Mariner West and Vantage pipeline were 34,000 b/d in 2014 and 65,000 b/d in 2015. Two waterborne ethane export terminals began operating in 2016, averaging 35,000 b/d in second-half 2016, 98,000 b/d in first-half 2017, and 138,000 b/d in second-half 2017.
The combined volume of ethane exports via both pipeline to Canada and waterborne terminals was 153,000 b/d in first-half 2017 and 207,000 b/d in second-half 2017. Ethane exports in second-half 2017 were enough to feed 7.4 billion lb/year of ethane-only ethylene plants operating at 100% of nameplate capacity.
In 2012, US ethane exports were zero but propane and butane exports were 196,500 b/d, according to EIA statistics. In 2017, EIA reported ethane exports averaged 180,200 b/d, while propane and butane exports averaged 1.04 million b/d. In November and December 2017, total US exports of light NGL feeds averaged 1.36 million b/d and 1.41 million b/d, with ethane exports accounting for 18.2% and 16.6%, respectively. US midstream companies had become the world’s dominant source of waterborne NGL exports within just 5 years.
US ethane supply now flows to Canada (pipeline only), Northwest Europe, and India. As more ethylene producers around the world develop necessary storage and receiving terminal infrastructure, US waterborne ethane exports will continue to increase (Table 4).
Ethane price trends
As almost all new USGC ethylene plants were designed to use purity ethane feeds, discussion of price trends focuses on spot prices for purity ethane in Mont Belvieu, gas-plant recovery margins for various regions, and ethylene production costs for ethane and other major feeds. In second-half 2017, spot prices for purity ethane varied within a range of 25.0-26.75¢/gal until December 2017, when prices—succumbing to yearend inventory management pressures and heavy yearend vacation schedules—fell to 22.1¢/gal.
When NGL marketers and feedstock buyers returned to work in early January, prices promptly rebounded to 26-27¢/gal. Prices in January were higher than in any previous month since June 2014, when they reached 29¢/gal.
In response to cold weather throughout the eastern US, wellhead natural gas prices in the USGC and Kansas-Oklahoma spiked to $3.50-3.75/MMbtu in January vs. $2.25-2.75/MMbtu in December 2017. While the spike in wellhead natural gas prices increased ethane shrinkage costs by 2-3¢/gal in most production regions, natural gas prices fell by $0.50-1.00/MMbtu in February, with ethane shrinkage costs declining 4-7¢/gal in most regions and 10¢/gal in the Midcontinent. With plentiful ethane supply and record-high inventory in USGC storage, spot prices for purity ethane fell to 24¢/gal in February but rallied to 25¢/gallon in March. Natural gas prices declined again in March but by less than $0.10/MMbtu in most regions.
In first-half 2017, ethane recovery margins for gas plants with minimal propane losses were below breakeven levels in all production regions. In third-quarter 2017, however, recovery margins were 0.0-1.5¢/gal for gas plants in West Texas and New Mexico connected to older raw-mix pipelines with the lowest tariffs. The 1¢/gal improvement in purity ethane prices in March contributed to the continued improvement in ethane-recovery margins in the all-important ethane supply regions of West Texas-eastern New Mexico and Kansas-Oklahoma.
Although gas-plant recovery costs have dominated ethane prices since 2012, ethane’s alternative values vs. competing feedstocks will become influential in second-half 2018 and first-half 2019. In second-half 2017, ethylene production costs based on natural gasoline and refinery-sourced naphtha of similar quality were 15-16¢/lb in July. Prices for crude oil and motor gasoline increased 10-15%. Following the usual seasonal pattern, natural gasoline prices increased 23%.
Cash production costs based on natural gasoline and naphtha were 27-28¢/lb in November-December 2017 and increased to 33¢/lb in March 2018. While cash production costs for propane were 23¢/lb in third-quarter 2017 and 29¢/lb in the fourth quarter, costs slipped to 19-22¢/lb in first-quarter 2018. Production costs based on ethane were 12-13¢/lb in second-half 2017 and first-quarter 2018. Ethane’s cost advantage vs. natural gasoline was 19-22¢/lb in fourth-quarter 2017 and first-quarter 2018. Ethane prices needed to be as high as 55-60¢/gal for ethane to have maintained a 5¢/lb cost advantage vs. natural gasoline. During September-December 2017, ethane’s feedstock-parity values vs. propane were 63-69¢/gal before slipping to 42-48¢/gal in first-quarter 2018. To maintain a production cost advantage of 5¢/lb, ethane prices needed to be as high as 53-59¢/gal in fourth-quarter 2017 but only 32-38¢/gal in first-quarter 2018.
Price levels required to sustain full-ethane recovery for gas plants in low and intermediate-cost regions and ethane’s feedstock parity values vs. propane will converge as the dominant influences on purity ethane prices in second-half 2018 and first-half 2019.
Near-term outlook
In first-quarter 2017, Ingleside Ethylene LLC—a 50-50 joint venture of Occidental Chemical Corp. and Mexichem SAB de CV—started its 1.2-billion lb/year grassroots ethane-only ethylene plant, reaching full capacity in June 2017. While DowDuPont started up its new 1.5 million-tonne/year ethylene plant at Freeport, Tex., in September 2017, the plant did not reach full-capacity production until April 2018, according to PetroChem Wire’s daily reports.
By end-2018, Chevron Phillips Chemical Co. LP—a joint venture of Chevron Corp. and Phillips 66—will complete full startup of its 1.5-million tpy ethane cracker at its Cedar Bayou complex in Baytown, Tex., while ExxonMobil Chemical Co. will commission its 1.5-million tpy ethane steam cracker at Baytown, Tex. (OGJ Online, Mar. 12, 2018; Feb. 6, 2018).
Alongside Formosa Plastics Corp.’s proposed commissioning of expanded operations at its Point Comfort, Tex., petrochemical complex in 2019, Indorama Ventures Olefins LLC (IVO), a subsidiary of Thailand’s Indorama Ventures PCL (IVP), Bangkok, is set to restart a long-idled cracker able to process both ethane and propane feedstock from US shale to produce about 420,000 tpy of ethylene and 20,000 tpy of propylene in Lake Charles, La. Shintech Inc.—the US subsidiary of Shin-Etsu Chemical Co. Ltd., Tokyo—also plans to start up its 500,000-tpy grassroots ethylene plant in Louisiana’s Iberville Parish.
In 2020, Sasol Ltd. will commission a new 1.5-million tpy ethane cracker in Louisiana (OGJ Online, Aug. 26, 2016).
As these new plants begin ramping up to full capacity, ethane demand will climb steadily to 1.50-1.55 million b/d by yearend 2018, with demand in fourth-quarter 2018 running 350,000-375,000 b/d more than fourth-quarter 2017. Based on these estimates, all gas plants in low-cost production regions will return to full-ethane recovery mode. Older plants will return first, taking advantage of revenues generated by additional propane production.
USGC gas plants will return to full-ethane recovery when purity ethane prices reach 24-28¢/gal. At this level, some plants in the Rocky Mountains will resume full-ethane recovery. When prices reach 32-35¢/gal, most—and perhaps all—gas plants in the Rocky Mountains will return to full-recovery mode.
Petral Consulting forecasts US gas plant ethane production will average 1.50-1.65 million b/d in first-half 2018 and 1.70-1.80 million b/d in second-half 2018, with production reaching 1.90-1.95 million b/d by mid-2019.
The author
Daniel L. Lippe ([email protected]) is president of Petral Consulting Co., which he founded in 1988. He has expertise in economic analysis of a broad spectrum of petroleum products including crude oil and refined products, natural gas, natural gas liquids, other ethylene feedstocks, and primary petrochemicals.
Lippe began his professional career in 1974 with Diamond Shamrock Chemical Co., moved into professional consulting in 1979, and has served petroleum, midstream, and petrochemical industry clients since. He holds a BS (1974) in chemical engineering from Texas A&M University and an MBA (1981) from Houston Baptist University. He is an active member of the Gas Processors Suppliers Association.
