Worldwide oil, natural gas reserves exhibit marginal increases
Conglin Xu
Senior Editor-Economics
Laura Bell
Statistics Editor
Oil & Gas Journal’s annual look at worldwide proved oil and natural gas reserves shows marginal increases. OGJ data for oil reserves and production increasingly include natural gas liquids. Some countries’ gas reserves changed to dry gas reserves after adding NGL reserves explicitly into oil reserves.
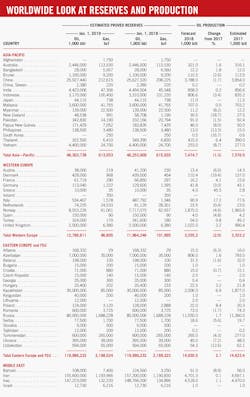
New estimates of worldwide proved oil reserves total 1.67 trillion bbl, slightly higher than last year’s level. Gas reserves total 7.08 quadrillion cf (quads), up from 7 quads a year ago.
The published reserves figures rely on survey responses and official updates released by individual countries, which are not provided every year in many cases. OGJ changes its estimate for a country only when it receives evidence that a change is in order. Therefore, in a given reserves summary, a year-to-year change—or lack thereof—may not necessarily reflect a change that applies to the calendar year alone.
When the original oil data are reported in tonnes, OGJ converted the data to volume units of barrels per day by applying conversion factors suggested by the International Energy Agency for each country.
OGJ expects worldwide oil production in 2018 to average 93.57 million b/d vs. 91.71 million b/d in 2017, with higher output from countries outside the Organization of Petroleum Exporting Countries more than offsetting OPEC declines.

Reserves changes
In 2017, the newly discovered geological oil and gas reserves in China fell to the lowest levels in nearly a decade. Oil and gas exploration activities were mainly conducted in Ordos, Tarim, Sichuan, etc., and sea areas.
According to the 2018 China Mineral Resources Report, China’s proved remaining oil reserves at yearend 2017 totaled 3.54 billion tons, a 1.2% rise from 3.5 billion tons at yearend 2016. China’s remaining reserves of conventional gas and shale gas increased by 1.6% and 62%, respectively, while that of the coalbed methane decreased by 9.5%. Combined, China’s gas reserves increased by 2.1% to 212.62 tcf.
According to the 2017-18 Indian Petroleum & Natural Gas Statistics report, India’s proved reserves of crude oil and condensate as of Apr. 1, 2018, were 594.49 million tons, down 1.6% from 604.1 million tons as of Apr. 1, 2017. Gas reserves increased by 3.9% with the most recent estimate at 1,339.57 billion cu m.
Indonesian’s proved oil reserves at yearend 2017 totals 3.17 billion bbl, down from 3.31 billion in the previous survey, according to figures from the Indonesian Directorate General of Oil & Gas. The country’s gas reserves at yearend 2017 were 100.37 tcf, down from 101.22 tcf at yearend 2016.
Geoscience Australia reported its total gas reserves at 113.53 tcf, of which 43.33 tcf is unconventional gas reserves. The estimates were made at yearend 2015, and no updates have been made since.
The Norwegian Petroleum Directorate’s estimate for total proved oil on the Norwegian continental shelf, which includes crude oil, condensate, and NGL, was about 8.55 billion bbl at yearend 2017. This is 11% more than the estimates at yearend 2016. The reason for this solid increase is reserve growth on a few producing fields and the submission of several plans for development and operation. The country’s gas reserves were down by 1.87 tcf, however.
According to the latest estimates from UK Oil & Gas Authority, the UK’s proved oil and gas reserves at yearend 2017 are both little changed from the levels at yearend 2016. However, probable and possible (2P) reserves fell from 5.7 billion boe at yearend 2016 to 5.4 billion boe at yearend 2017 as production in 2017 exceeded additions to reserves from new field developments and revisions in established fields.
The most recent estimates from the Danish Energy Agency put Denmark’s gas reserves at 968 bcf compared with 454 bcf in last year’s survey. Part of last year’s contingent resources for gas have been transferred to the reserves category due to the approval of the rebuilding of the facilities in Tyra field.
Canada’s oil and gas reserves moved lower. The country’s crude and condensate reserves are now estimated at 3.92 billion bbl, according to OGJ contacts at Canadian Association of Petroleum Producers. The latest estimate of Canada’s oil sands reserves is 163.47 billion bbl. Canadian gas reserves are now down slightly to 72.398 tcf.
Petroleos Mexicanos reported that as of Jan. 1, 2018, Mexico’s estimated proved reserves of oil totaled 6.43 billion bbl, which consisted of 5.87 billion bbl of crude and condensate and 553.8 million bbl of NGLs. Mexico’s proved dry gas reserves total 6,593 bcf, down from 6,984 bcf a year ago.
Crude oil reserves in Brazil in 2017 increased 1.6% to 12.4 billion bbl, while its gas reserves declined 2.11% to 13.06 tcf, according to the latest estimates of Brazilian National Petroleum Agency.
Argentina’s proved crude oil reserves at yearend 2017 totaled 2.02 billion bbl, a decline of 6.7% from a year ago. Its proved gas reserves increased to 12.55 tcf from 11.89 tcf in the previous estimate. This is according to the Argentinian Institute of Oil & Gas.
OPEC, Russia reserves
The reserves figures reported for OPEC members are referenced from the organization’s most recent annual statistical bulletin. Total proved crude oil reserves for OPEC are down 0.4% from a year ago to 1,214.72 trillion bbl. Total gas reserves moved up by 4.6 tcf to 3,392 tcf. OPEC’s oil reserves account for 73% of the worldwide total and gas reserves account for 48% of the world’s gas reserves.
Russia proved up 550 million tons of oil and condensate to A+B+C1 status in 2017 (amounting to a 100.6% replacement ratio), which compares with 575 million tons in 2016, and 890 billion cu m of gas (128.9%), which compares with 701 billion cu m in 2016. Total reserves of liquid hydrocarbons increased by 800 million tons while total gas reserves rose by 3,700 billion cu m.
The latest estimate by the Ministry of Natural Resources for the volume of reserves proved up to A+B+C1 status in 2018 is for 550 million tons of oil and 700 billion cu m of gas. Due to lack of proper conversion factors from A+B+C1 category to SPE category, OGJ keeps Russian reserves intact.
US reserves
US proved crude oil and condensate reserves remained at 35.2 billion bbl at yearend 2016, a net decline of 17 million bbl from yearend 2015, according to the latest reserves report from the US Energy Information Administration.
Gains of 846 million bbl in proved reserves onshore in the Lower 48 states were offset by declines of 865 million bbl in proved reserves in Alaska and the federal offshore.
Texas and Oklahoma experienced the largest net increases in proved reserves of crude oil and lease condensate of all the states in 2016, mostly from development of liquids-rich shale plays in the Permian basin and SCOOP and STACK plays in the Anadarko basin.
Proved reserves of gas increased 5% to 341.1 tcf at yearend 2016. Pennsylvania added 6.1 tcf of gas proved reserves, the largest net increase of all states in 2016 because of development of the Marcellus shale in the Appalachian basin. The next largest net gains in gas proved reserves by volume in 2016 were in Oklahoma and Ohio because of development of the SCOOP and STACK plays and the Utica shale play.
The share of gas from shale compared with total US gas proved reserves increased from 54% in 2015 to 62% in 2016.
The estimated volume of gas plant liquids contained in proved reserves of total gas increased from 12.7 billion bbl in 2015 to 14.7 billion bbl in 2016, a 16% increase. Correspondingly, US dry gas proved reserves increased from an estimated 307.7 tcf in 2015 to 322.2 tcf in 2016, an increase of 5%.
Stronger oil and gas prices combined with continuing development of shales and low permeability formations drove US proved reserves to a new record in 2017.
According to the newly released reserves report, EIA estimates that US had 41,990 million bbl of oil and lease condensate proved reserves as of yearend 2017—an increase of 19.2% from yearend 2016. Proved crude and condensate reserves rose 19% onshore in the Lower 48 states and proved reserves rose 28% in Alaska and 18% in the federal offshore.
The US had 464.3 tcf of proved gas reserves as of yearend 2017. US proved reserves of total natural gas (including NGPL) increased by 123.2 tcf (36.1%). Operators in Pennsylvania and Texas reported the largest net increases in gas proved reserves in 2017.
The estimated volume of NGPL contained in proved reserves of total gas increased from 14.7 billion bbl in 2016 to 19.2 billion bbl in 2017, a 30% increase. US dry natural gas proved reserves increased from an estimated 322.2 tcf in 2016 to 438.5 tcf in 2017, an increase of 36%.
Worldwide oil production
OGJ expects that worldwide oil production in 2018 will increase to an average of 93.57 million b/d vs. a 2017 average of 91.71 million b/d, supported by expansions of non-OPEC production.
Total OPEC oil production this year, including crude oil, condensate, and NGLs, will average 38.54 million b/d, down from 39 million b/d last year. Venezuela oil production will decline nearly 30% from a year ago.
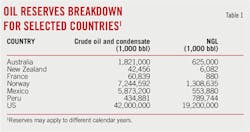
In the US, oil output this year is surging despite infrastructure bottlenecks, rising costs, and a shift in investment strategy towards improving balance sheets. Crude production rose to 10.9 million b/d, another record high and up 1.55 million b/d on a year earlier. NGL production increased to 4.37 million b/d, a gain of about 600,000 b/d. Total oil supplies are forecast to climb more than 2.1 million b/d to hit 15.27 million b/d.
For the year, Canadian oil output is forecast to expand by 5.4% to 5 million b/d, which again put domestic heavy crude grades under pressure due to limited pipeline capacity.
Brazil output is getting lower due to steep declines at mature fields, heavy maintenance, and a later-than-expected start-up of production units.
Russia’s crude and condensate production is expected to average 11.2 million b/d this year. Including NGLs from gas processing plants, output will reach nearly 11.6 million b/d. This is up 1.7% from 2017 output. Kazakhstan total oil output will expand by 6.9% to 2 million b/d in 2018.
North Sea supplies will be lower than a year ago, with the decline mostly from Norway and, to a lesser extent, Denmark. Norwegian oil production is expected to average 1.87 million b/d, 4.6% below a year ago because of higher-than-expected maintenance and aging fields. The declines in Norway and Denmark will be partly offset by higher output in the UK. UK total production will rise to 1.02 million b/d, about 31,600 b/d higher than a year ago.
Output continues to fall in the Asia-Pacific region. Collective oil output this year will slide 1.3% to 7.47 million b/d, mainly due to declines in China and Indonesia. Average oil production in China for 2018 will drop 1.7% to 3.79 million b/d.