Midstream capacity constraints surface sooner than expected
Dan Lippe
Petral Consulting Co.
Houston
NGL prices in Conway, Kan., sank to discounts of 20-30¢/gal vs. prices in Mont Belvieu, Tex., and deep discounts persisted through early fourth-quarter 2018. Prices for purity ethane spiked to 60-65¢/gal in September, while differentials between purity ethane and ethane-propane mix widened to 10¢/gal for most of the month. Despite these dramatic changes in interregional pricing differentials and unexpected strength in purity ethane prices, developments in normal butane markets merit attention.
The previous article in this series (OGJ, June 4, 2018, p. 62) examined ethane markets and the impact of the surge in ethylene production as several new world-scale plants came on stream. Pricing differentials between gas-plant normal butane and refinery butane, however, indicate the normal butane balance in the US Gulf Coast (USGC) reached a tipping point that has implications for winter RVP-blending demand and exports during fourth-quarter 2018 and first-quarter 2019.
Consistent with the series’ focus on midstream industry trends, this article also provides highlights of basic trends in NGL production with a focus on year-over-year NGL supply growth in key regions in second-half 2017 and first-half 2018. Midstream companies will resolve these constraints within the next few years. More importantly, crude oil producers in the Permian basin also encountered pipeline-capacity constraints for crude oil and natural gas in first-half 2018. Pipeline constraints for crude oil and associated natural gas will tend to reduce growth rates for NGL raw-mix production in this increasingly important basin.
NGL raw-mix production
Crude oil and associated gas production have been the primary drivers for gas-plant NGL production in the USGC, Midcontinent, and Rocky Mountains since 2012. During the general downturn in oil-directed drilling activity and in sharp contrast with Eagle Ford, growth in crude oil production in the Permian basin (West Texas, southeast New Mexico) slowed but did not decline.
Crude oil production in the Permian basin and Eagle Ford accounted for 83-85% of total crude production in Texas in 2013-17. In 2011-13, crude production in the Permian basin (Texas Railroad District 8, 8A, 7C, and 10) accounted for 24.8% of growth in production in Texas while Eagle Ford growth accounted for 67.9%. In 2013-17, the Permian basin accounted for 56.0% of growth in Texas production while Eagle Ford accounted for only 35.6%. The primary driver for USGC NGL production is clearly now West Texas and eastern New Mexico. All eyes are on crude oil and associated natural gas production in the Permian basin and the race to complete at least two natural gas pipelines and three or more new crude pipelines. In the meantime, growth in NGL production through yearend 2019, most likely, will be slower than in first-half 2018.
Trends in production ratios for propane+ vs. crude oil production in New Mexico and Texas provide quantitative insight into constraints limiting gas-plant NGL production.
Production ratios in New Mexico were 23-27% in 2014-16 but fell to 20.3% in 2017 and 20% in first-half 2018. The drop in propane+-crude oil production ratios in second-half 2017 and extending into first-half 2018 indicate gas-pipeline capacity constraints and a consequent reduction in the volume of associated gas delivered to gas plants in southeast New Mexico.
Similarly, production ratios in Texas were 25.9% in 2014 and 27.6% in 2015-16. Production ratios began to slip in second-quarter 2017 and were 25.6% in fourth-quarter 2017, 24.5% in first-quarter 2018, and 25.7% in second-quarter 2018. In second-half 2017 and first-half 2018, ratios were 5-8% less than in the previous year. As was true in New Mexico, gas-pipeline capacity constraints limited delivery of associated gas production to gas plants in the Permian basin and Eagle Ford shale.
A similar analysis for Kansas-Oklahoma revealed no major decline. Production ratios were 48-50% and were consistent with richer associated natural gas production and minimal constraint in natural gas pipeline takeaway capacity.
Regional trends
Gas plants in the USGC, Rocky Mountains, and Kansas-Oklahoma accounted for 86% of US NGL raw-mix production in second-half 2017. Propane+ production in these three regions was 1.79 million b/d in second-half 2017 vs. 1.69 million b/d in first-half 2017. Production increased to 1.88 million b/d in first-half 2018 and was 191,000 b/d more than in first-half 2017. Petral Consulting forecasts production will increase to 1.95-1.97 million b/d in first-half 2019 and year-over-year growth in propane+ will slow to 75,000-85,000 b/d.
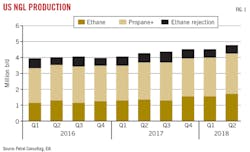
During first-quarter 2018, total US propane+ production reached 2.42 million b/d and ethane production 1.58 million b/d. Ethane production increased to 1.70 million b/d in second-quarter 2018, while propane+ production totaled 2.61 million b/d. Year-over-year production growth for all NGL components was 470,000 b/d in first-quarter 2018 and 601,000 b/d in the second quarter. Petral Consulting estimates production increased 640,000-660,000 b/d in third-quarter 2018, but growth rates will slow to 350,000-380,000 b/d in the fourth quarter and 430,000 b/d-460,000 b/d in first-quarter 2019. Continued growth in ethane demand and improved ethane-recovery margins are an important consideration for year-over-year growth in US NGL production for second-half 2018 and first-half 2019.
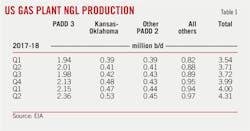
According to the US Energy Information Administration (EIA), NGL production from USGC gas plants averaged 4.31 million b/d in second-quarter 2018, reaching 4.34 million b/d in June (Fig. 1). Production during the second quarter was 601,100 b/d more than in the same period in 2017. Year-over-year growth in ethane recovery was 348,500 b/d and made up 58% of raw-mix production growth. Year-over-year growth in propane+ recovery was 252,600 b/d and was 42% of raw-mix growth.
NGL production from Midcontinent gas plants was 985,300 b/d in second-quarter 2018, up 163,600 b/d from second-quarter 2017. Within the Midcontinent, production from Kansas-Oklahoma gas plants was 530,500 b/d, or 120,800 b/d higher vs. the same period in 2017. Growth in raw-mix production in Kansas-Oklahoma accounted for 74% of overall growth in the Midcontinent. Gas plants in the western Upper Midwest (primarily North Dakota) produced 269,000 b/d in second-quarter 2018, up 49,500 b/d from second-quarter 2017.
NGL production in the Rocky Mountains—primarily from gas plants in Colorado and Wyoming—was 420,000 b/d in second-quarter 2018, up 33,600 b/d from a year earlier. Ethane prices in second-quarter 2018 were 3-4¢/gal higher vs. second-quarter 2017.
Recovery margins for gas plants in high-cost, full-pipeline tariff regions improved by 3-5¢/gal in second-quarter 2018 but remained too weak for independent gas processors. The same year-over-year improvement in margins, however, was enough to support full recovery for fully vertically integrated midstream companies. The improvement in ethane-recovery margins, particularly for fully integrated companies, provided strong economic support for full-ethane recovery by this category of gas plant operators.
Table 1 summarizes quarterly trends in US gas plant NGL production through second-quarter 2018.
Ethane rejection
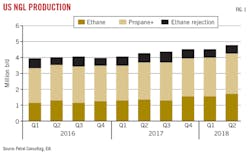
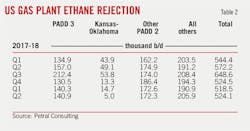
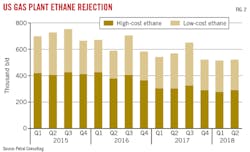
Petral Consulting estimates ethane rejection fell to 510,000-530,000 b/d in fourth-quarter 2017 from 630,000-660,000 b/d in third quarter. In first-half 2018, Petral Consulting estimates total US ethane rejection was 520,000-530,000 b/d (Fig. 2).
Regionally, ethane rejection in the high-cost basins (Rocky Mountains, northern-tier Midcontinent, and East Coast) was 289,000 b/d (55% of total US production). Even through ethane-recovery margins in second-quarter 2018 were breakeven or positive for all gas plants in core-supply regions (USGC, Kansas-Oklahoma, and Rocky Mountains), ethane rejection was 140,000 b/d in the USGC and 120,000-130,000 b/d in the Rocky Mountains, but only 2,000-6,000 b/d in Kansas-Oklahoma (Table 2).
As gas processors in the Rocky Mountains and western Oklahoma redirected maximum raw-mix volumes into pipelines to the USGC, some raw-mix pipelines (West Texas to Mont Belvieu) reached full capacity in second-quarter 2018. Texas and New Mexico gas plants rejected 60,000 b/d in June due to capacity constraints rather than for economic reasons. Even through ethane rejection in the second quarter was up 58,000 b/d from 2017 and 15,600 b/d more than in first-quarter 2018, total ethane recovery in the second quarter was 311,600 b/d higher from a year earlier and 117,200 b/d more vs. first-quarter 2018.
With more new ethylene plants scheduled to start up in the next four quarters, one question remains of highest importance: Will midstream companies increase pipeline and fractionation capacity in Mont Belvieu soon enough to avoid feedstock supply constraints? This issue will be addressed in the next article of this series.
NGL market overview
Three markets account for more than 90% of US NGL demand:
• Petrochemical feedstock.
• Gasoline blending.
• Retail space heating and internal combustion.
International markets, however, have also become increasingly important outlets for US NGL production.
All five NGL components are used as feedstock in petrochemical production, and normal butane, isobutene, and natural gasoline are used in gasoline blending. Retail space heating and internal combustion-engine markets, however, consume only propane. Of the various end-use markets for normal butane, only the refining industry notably increased domestic demand for gas-plant normal butane 2013-17.
While this article provides an overview of ongoing developments in ethylene-industry demand for NGL feedstocks, it primarily focuses on developments in refinery demand for normal butane in the USGC and Midcontinent.
Petrochemical feedstock demand
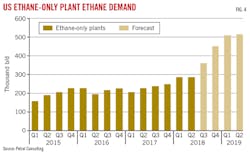
Ethane’s only major end use is as feedstock for ethylene production. US ethylene capacity in June 2018 was 72.4 billion lb/year. Each US plant fits into one of three categories: no feedstock flexibility, limited feedstock flexibility, and extensive feedstock flexibility. At yearend 2017, eight US ethylene plants were included in the ethane-only category. By June 2018, ten US ethylene plants with a combined capacity of 16.5 billion lb/year were in the ethane-only category. Each new ethane-only plant consumes 75,000-90,000 b/d of purity ethane (vs. older plants that consume 28,000-45,000 b/d purity ethane).
Petral Consulting determines monthly ethylene production and feedstock demand by conducting an independent monthly survey of plant operating rates and feedslates to track consumption of purity ethane, ethane-propane mix, ethane and propane contained in refinery off gas, purity propane (HD5), normal butane, natural gasoline, refinery-sourced naphtha, and gas oil.
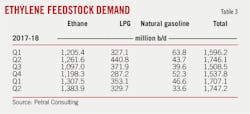
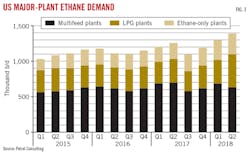
Ethylene producers consumed 1.71 million b/d of NGL feeds (ethane, propane, normal butane, and natural gasoline) in first-quarter 2018 and 1.75 million b/d in second-quarter 2018 (Fig. 3). NGL feeds accounted for 94% of total fresh feed in first-quarter 2018 and 95% in second-quarter 2018. First-quarter 2018 demand was 160,000 b/d more than in fourth-quarter 2017. Demand in second-quarter 2018 was 28,000 b/d more than in the year-previous quarter.
Ethane demand was 1.31 million b/d in first-quarter 2018 and increased to 1.38 million b/d in second-quarter 2018, reaching 1.42 million b/d in July (Table 3). Ethane (purity ethane, ethane contained in ethane-propane mix, and ethane in refinery off gas) accounted for 72% of demand for fresh feed in first-quarter 2018. In second-quarter 2018, ethane accounted for 75-76% of total demand.
Fig. 4 shows estimated US ethane-only plant demand through first-half 2019.
In 2017 and first-half 2018, normal butane was the only feedstock to provide ethylene producers with major economic incentives and was ethane’s only competitor. As ethane demand rose and purity ethane prices increased to support full recovery in low-cost regions, ethylene production costs based on purity ethane were consistently more than costs based on normal butane. For the first time in several years, ethane was more expensive than normal butane, even in first-quarter 2018, when refinery demand was at its peak.
Since normal butane was the only feedstock with lower production costs, ethylene feedstock demand for normal butane rose, reaching 75,400 b/d in first-quarter 2018, 24,000 b/d (47%) above the 3-year average.
Refinery demand for butane typically falls sharply in March-April while production surges to its peak seasonal volume by May. Accordingly, inventory in USGC storage begins to build in April.
In first-half 2018, all the usual seasonal changes in USGC butane market balances occurred right on schedule and normal butane maintained its cost advantage of 3-7¢/lb vs. purity ethane in every month of first-half 2018. Even though inventory in reportable USGC storage increased by 11 million bbl more than the 5-year average in second-quarter 2018, feedstock demand in the same quarter was 85,000 b/d, just 7,500 b/d (9.6%) higher than the 5-year average. In any previous year, ethylene producers would have increased normal butane consumption to 100,000-120,000 b/d in second-quarter 2018. Instead, demand was constrained by a tightening USGC market balance caused by the year-to-year growth in exports.
Normal butane exports
International LPG buyers continued to increase normal butane purchases. Exports from USGC terminals in first-quarter 2018 were 2.2 million bbl more than in 2017 and 5.3 million bbl more in second-quarter 2018. If USGC exports maintain first-half volumes in second-half 2018, total 2018 exports will be up 13 million bbl from 2017.
Refinery demand for normal butane
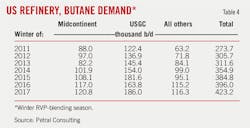
In winter 2011, refinery demand for gas-plant normal butane was 165,900 b/d, increasing to 256,500 b/d by winter 2016 and 255,500 b/d by winter 2017. Refineries also increased the use of refinery butanes recycled from storage. Recycle volumes of refinery butane rose to 167,600 b/d in winter 2017 from 107,800 b/d in winter 2011. The combined volumes of gas-plant normal butane and refinery butane increased by 149,500 b/d (54.6%) to 423,200 b/d in winter 2017 from 273,700 b/d in winter 2011 (Table 4).
In all regional markets except the USGC, gas-plant normal butane and refinery butane are commingled in storage and are interchangeable during the winter RVP blending season. In the USGC, petrochemical and midstream companies with butane isomerization units are very sensitive to the major quality differentials between gas-plant normal butane and refinery butane. For the past 25 years, quality differentials supported premium prices in the Mont Belvieu spot market for gas-plant normal butane vs. refinery butane, especially during the summer.
Combined refinery inputs, or demand, for volumes of gas-plant normal butane and refinery butane in the USGC were 90,200 b/d in winter 2011 but increased to 136,500 b/d in winter 2017. During 2013-16 at Mont Belvieu, price ratios for gas-plant normal butane vs. conventional unleaded regular gasoline were at historic lows.
Refinery operations planning teams are constantly on alert for opportunities to adjust gasoline-blending operations to reduce costs and increase profits. As normal butane price ratios vs. unleaded regular gasoline declined during 2011-17, demand for both gas-plant normal butane and refinery butane increased, as did input ratios vs. gasoline production. Operations planning teams began tweaking the mix of gasoline blendstock in 2012, prompting increased butane demand as RVP blendstock began to rise in 2014, increasing each year through 2017. Demand for refinery butane, incidentally, was also directionally higher in winter 2017 but did not match the strong upward trend for gas-plant normal butane.
The steady growth in refinery demand for normal butane for winter RVP blending since 2011 and rising exports in 2017-18 were enough to have a material impact on pricing differentials between gas-plant normal butane and refinery-grade butane. Between 2015 and second-quarter 2017, spot prices for gas-plant normal butane averaged 4.95¢/gal more than refinery butanes. In second-quarter 2018, gas-plant normal butane prices were 9.87¢/gal more than refinery butane. A 10¢/gal premium is unprecedented, but it communicates loud and clear that refinery butane remains in surplus while gas-plant normal butane in the Mont Belvieu market is now in tight supply, even in midsummer, when refinery demand is at its seasonal minimum.
During the offseason, demand for gas-plant normal butane is the sum of refinery demand, exports (both based on EIA statistics), feed to merchant butane isomerization units (Petral Consulting estimate), and about 50% of ethylene feedstock demand (Petral Consulting survey results). In second-quarter 2018, refinery demand averaged 37,500 b/d, exports 152,600 b/d, and feed to merchant isomerization units 41,000 b/d. Petral Consulting survey results show ethylene feedstock demand for gas-plant normal butane was 42,500 b/d. Total demand for gas-plant normal butane was 286,300 b/d in second-quarter 2018, up about 60,000 b/d from the same period in 2017. After comparing year-over-year increases in demand for each end use, exports accounted for the increase in overall normal butane demand.
Petral Consulting estimates production of gas-plant normal butane from all USGC fractionators was 210,000 b/d in second and third-quarters 2017, while demand for gas-plant normal butane was 220,000-230,000 b/d. In 2018 to date, USGC fractionator production has averaged 235,000-245,000 b/d, 45,000-55,000 b/d less than demand.
Gas-plant normal butane and refinery butane are different commodities due to variations in refinery-butane composition and frequent problems with contaminants such as chlorides and fluorides. Even as total inventory increased, the surge in premium prices for gas-plant normal butane indicates day-to-day availability was substantially tighter in second-quarter 2018. Gas-plant normal butane pricing maintained premiums of 10¢/gal vs. spot prices for refinery-grade butane. Availability remained tight into July and August, and price premiums vs. refinery-grade butane were 20¢/gal in July, just ahead of refineries beginning the mid-August swing to winter-grade gasoline production.
Consistent with the early phase of winter RVP-blending demand, prices for refinery-grade butane began converging with those for gas-plant normal butane, narrowing price premiums for gas-plant normal butane to 13¢/gal in August 2018 and 8¢/gal in September. These August and September premiums, however, were still 2.5 to 3.5 times more than the 2014-16 averages. August-September 2018 premiums indicate gas-plant normal butane availability remained tight, but the sharp decline in refinery-grade butane production also began reducing the seasonal surplus, helping to narrow differentials between the two butane grades.
Blending expectations
In winter 2013, USGC refineries consumed 145,000 b/d of gas-plant normal butane and refinery butane. As prices for gas-plant normal butane and refinery-grade butane weakened relative to unleaded regular gasoline, refinery planning staff found ways to incrementally increase use of normal butane during 2014-17. In winter 2017, USGC refineries consumed 186,000 b/d of gas-plant normal butane and refinery-grade butane. Inventory in reportable USGC storage was on track to reach only 31 million bbl by Oct. 1, 2018, or 6 million bbl less than in 2017. Internationally, prices will increase monthly through January 2019, and perhaps even into February, raising questions regarding USGC supply’s ability to meet peak RVP-blending export demand at the same time.
Near-term outlook
During second-half 2018 and first-half 2019, midstream companies will race to complete new crude oil and natural gas pipelines. Until the first of these new pipelines are in service, spot prices for West Texas Intermediate at Midland, Tex., will remain at deep discounts to prices in Cushing and Houston, and production growth rates will be slower than in first-half 2018. Similarly, until new natural gas pipelines are in service, crude oil producers in West Texas and eastern New Mexico will continue flaring associated gas. These factors will continue to limit growth in NGL production from Permian-basin gas plants. Slower growth in NGL raw-mix production will be particularly important for ethane and normal butane markets in the USGC during second-half 2018 and first-half 2019.
Ethane prices in September 2018 reached levels not seen since first-half 2012. At that time, however, crude prices were $90-105/bbl, and midstream raw-mix pipeline capacity had increased by 219,000 b/d from 2008; fractionation capacity also had increased by almost 400,000 b/d vs. 2008. In the current market, ethane inventory in reportable USGC and Midcontinent storage has remained above 40 million bbl, and ethylene producers have an equivalent volume in private storage.
Normal butane prices in Mont Belvieu in August-September 2018 were within the recent historic range based on price ratios vs. conventional unleaded regular gasoline. Normal butane inventory, however, was 1.0-2.5 million bbl less than in 2014-17. Inventory accumulation rates in August-September are generally lower, and peak inventory in USGC storage will be 4-6 million bbl less than in 2017. Gas-plant normal butane availability in the USGC is likely to remain tight during fourth-quarter 2018 and into February-March 2019.
USGC ethane balances hinge on whether spot prices will push some ethylene feedstock buyers to reduce ethane demand. Similarly, normal butane prices may prompt refinery operations planning teams to reduce the butane content in motor-gasoline blending operations in winter 2018. Similarly, if normal butane prices are not too high this winter, and refinery demand is equal to winter-2017 volumes, USGC markets will be even tighter in second and third-quarters 2019.
The author
Daniel L. Lippe ([email protected]) is president of Petral Consulting Co., which he founded in 1988. He has expertise in economic analysis of a broad spectrum of petroleum products including crude oil and refined products, natural gas, natural gas liquids, other ethylene feedstocks, and primary petrochemicals.
Lippe began his professional career in 1974 with Diamond Shamrock Chemical Co., moved into professional consulting in 1979, and has served petroleum, midstream, and petrochemical industry clients since. He holds a BS (1974) in chemical engineering from Texas A&M University and an MBA (1981) from Houston Baptist University. He is an active member of the Gas Processors Suppliers Association.
