North American propane market adapts to supply surge
Ken Chow
Ajey Chandra
Muse, Stancil & Co.
Houston
Rail shipment of propane into new and seasonal markets will continue to be an investment opportunity in the US and elsewhere in North America. Flat domestic demand and limited demand growth, however, mean that exports to international markets provide the only floor for prices, essential to ensuring continued production. While weather may still lead to seasonal price volatility, export outlets will also reduce price volatility on an annual basis.
Rising gas production, NGL recoveries
Over the past 10 years, the US midstream sector has presented many investment opportunities stemming from major growth in the volume of NGLs recovered through rising associated and nonassociated natural gas production. The increase in natural gas production can be difficult for midstream companies to manage due to producers’ ability to quickly ramp up production or curtail drilling based on market prices for crude oil and natural gas. While upstream companies can nimbly adjust their growth and drilling plans, midstream companies are challenged to respond accordingly due to construction time, leading to capacity constraints. The challenges can be particularly acute for handling associated gas production and recovery of NGLs when producers are targeting crude oil to drive their well economics. Because of this, there is a disconnect between the growth in natural gas production and growth in the amount of NGLs recovered at gas processing plants.
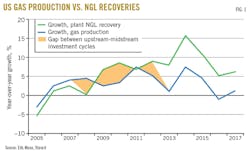
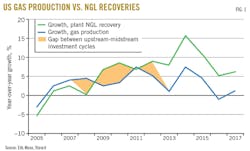
The midstream industry struggled to provide adequate NGL extraction, processing, and takeaway capability to keep pace with rising natural gas production, particularly 2007-13. Year-on-year growth trends between natural gas production and NGL recoveries did not correlate during this period (Fig. 1). During years when natural gas production rose, growth in NGL recovery declined, and vice versa, reflecting the disconnect between the midstream and upstream investment cycles.
This divergence between natural gas production and NGL recovery trends dissipated during 2013-14, when new gas processing capacity and NGL infrastructure came online to largely alleviate the investment-cycle disconnect. From 2013 to 2017, growth in NGL recovery followed the rise and fall in natural gas production growth. While the growth trends now mirror each other, recent growth in NGL recovery has far outpaced growth in natural gas production. In 2016, while year-on-year natural gas production declined by 1% from 2015, NGL recovery volumes increased by 5%. For the past 4 years, year-on-year growth in NGL volumes has been in the range of 5-15%, while growth in natural gas production has averaged only 3%. This trend, if it continues to be sustainable, indicates that a greater amount of capital will continue to be directed at the midstream sector to support increased NGL production.
Beginning in 2009, the percentage growth in US NGL-recovery volumes began consistently exceeding the percentage growth in natural gas production. This rapid growth has created NGL infrastructure constraints that still linger today in some areas. Several different events and trends occurred in major producing regions that have contributed to NGL infrastructure bottlenecks, including:
• More stringent regulations on gas flaring.
• Reaching the upper limit of ethane that could be blended into natural gas and still meet pipeline specifications.
• Cryogenic gas processing plants becoming the preferred NGL recovery technology.
• Producers targeting liquids-rich zones.
Development of pipeline and processing facilities to handle NGLs typically lags the development of crude oil and natural gas infrastructure. This lag can be attributed to the differing producer netbacks for crude, natural gas, and NGL streams. For associated gas, the producer’s primary economic incentive is crude production from the well. State regulators permit the gas to be flared when there is no gas pipeline infrastructure available for connection.
Domestic NGL production drivers
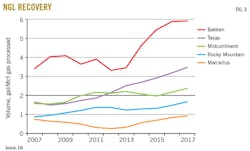
Bakken production history is an example of how disparate the timing can be to invest in infrastructure to handle crude, natural gas, and NGLs. North Dakota crude oil production from the Bakken ramped up in 2008, while investment in gas-gathering and processing installations lagged, causing natural gas and NGL production to grow at a much slower pace (Fig. 2). With startup of the Vantage ethane pipeline to Canada in 2014 and gas-flaring requirements taking effect later that year, 2014 proved to be the high watermark for growth in NGL-volume recoveries.
Although the gap between crude production and recovery of nonassociated gas and NGLs has narrowed, the need for gas and NGL-infrastructure investment in the region is still unmet. While Bakken crude production peaked in 2015, natural gas and NGL production volumes have continued to grow. If North Dakota crude production continues to recover, then another round of sizable investments in gas-gathering, processing, and NGL-handling facilities will be needed.
This type of growth in hydrocarbons production is also occurring in other producing regions such as the Permian, Marcellus-Utica, and Rocky Mountains, providing insight into the next NGL-infrastructure investment cycle.
Another development that has driven NGL-infrastructure investments is the increased volume of NGLs recovered per Mcf of natural gas produced, which has risen during the past 10 years across all major producing regions (Fig. 3). This growth can be attributed to producers targeting liquids-rich acreage and midstream companies deploying enhanced technology to recover greater amounts of NGLs from the gas stream, such as deep-cut cryogenic gas processing plants.
Given its high-liquids content in associated gas, extracted quantities of NGLs have risen dramatically with increased installation of cryogenic gas processing plants. In Texas, increased NGL recoveries were initially driven by Eagle Ford production but are now driven by Permian production. In recent years, NGL recoveries have also risen in the Rocky Mountain region as producers focused on liquids-rich drilling opportunities in the Niobrara shale of the DJ basin. The US Midcontinent also has experienced an upward tick in NGL-recovery volumes due to increased SCOOP-STACK drilling activity and production. In the Marcellus, the trend of declining NGL-recovery rates reversed in 2013 as more NGL-takeaway capability was built, incentivizing extraction of more NGLs from natural gas. Moreover, gradually increasing wetness of natural gas volumes transported from Texas and the Midcontinent to northeastern destinations began to limit the amount of high-ethane gas in the Marcellus that could be blended into the interstate gas pipeline system.
Processing technology shift
Typically, inlet-gas composition and volume, as well as existing NGL infrastructure in the vicinity, dictate the type of gas processing equipment selected for deployment: a Joule-Thomson expansion valve (JT valve), a refrigeration unit, or a cryogenic plant.
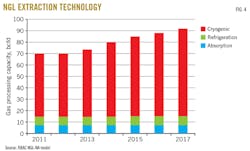
Plant additions in Pennsylvania, Ohio, Texas, and Oklahoma, corresponding to growth in shale gas production in those states, have led to increased US gas processing capacity. Highlighting the popularity of modular prefabricated gas plants as opposed to stick-built plants, the most common of the new installations were 200-MMcfd cryogenic plants, followed by 60-MMcfd plants (Fig. 4).
The modular approach to their construction has made it economically attractive to deploy cryogenic-plant technology for a wider range of inlet-gas stream volumes by reducing installation costs and deployment time. With far-higher recoveries of every NGL component than that of refrigeration processes, the prevalence of greenfield cryogenic plants has led to sizable growth in NGL production.
Constrained market outlets
The superior recovery efficiency of cryogenic processing plants created a disproportionate increase in extraction volumes of ethane and propane when compared to historical recoveries of other NGL components. The increase in ethane and propane recovery ramped up in 2013, coinciding with startup of an increasing number of cryogenic gas processing plants (Fig. 5).
The rise in NGL recoveries meant that fractionation capacity would have to be added, resulting in sizable additions to regional propane supplies. Because NGL raw-mix pipeline transportation to the main fractionation and storage hubs at Mont Belvieu, Tex., and Conway, Kan., was constrained, local fractionation became more commonplace. This was an economically feasible solution for propane, since the commodity could be moved by truck or rail to nearly any North American market.
Despite the logistical flexibility available for propane, the dramatic rise in propane-recovery volumes still led to constrained market outlets for the commodity. While a depropanizer can be installed at a gas processing plant to supply the local market by truck, the local market for propane is usually limited. A rail terminal can also be built to deliver propane to larger but more-distant markets. Meanwhile, additional fractionation capacity at Mont Belvieu (PADD 3), Conway (PADD 2), and in the Northeast (PADD 1) has left more propane in search of markets. (See accompanying box for PADD regions.)
While there are very few pipelines dedicated to the transportation of propane (Enterprise Products Partners LP’s TE Products Pipeline, Mid-America Pipeline, and Dixie Pipeline systems), a greenfield, dedicated propane pipeline would be uneconomical to build, given that seasonal demand for propane in various parts of the country results in insufficient baseload volumes to justify constructing a new pipeline. Subsequently, shipping propane by rail has become the logistical answer.
Rise of rail
Rail movements within PADDs 1 and 2 have risen, displacing pipeline shipments from PADD 3 (Fig. 6). Canadian exports into PADD 5 increased in 2016 as lower-priced Canadian propane made it attractive for export to the Asia-Pacific markets. Canadian shipments to PADD 1 have declined as local fractionation of propane backed out Canadian material, causing a rise in shipments from Canada into PADD 2. With the reversal into Western Canada of Kinder Morgan Inc.’s Cochin pipeline, Canadian propane suppliers resorted to rail to move additional volume to PADD 2 as well. Mexico became the next market opportunity for Canadian propane when the country opened its propane market and instituted market pricing.
Historically, propane has been produced in Mont Belvieu, Tex., and Conway, Kan., with smaller production hubs in West Texas and elsewhere on the US Gulf Coast (USGC), both in PADD 3. Pipelines transport propane to PADDs 1 and 2, where the major consumers use propane for heating and agriculture. Establishment of a new fractionation hub in the Ohio-Pennsylvania-West Virginia region of PADD 1 upended the historical flow pattern of propane from the USGC supply center to the Northeast demand centers. Continued growth in fractionation in the Northeast may call for a new price benchmark in addition to Mont Belvieu and Conway, but the lack of NGL storage may limit that possibility.
While the increase in PADD 1 propane production helped to alleviate historical delivery constraints to the Northeast market during the winter heating season, it also created a seasonal propane surplus in the region.
To further compound the supply-demand imbalance, US domestic propane consumption has remained relatively flat. The use of propane in residential and transportation sectors faces increasing competition from natural gas and electricity.
Rising exports
Growing propane supplies in the US and Canada, coupled with limited growth prospects in domestic demand, have resulted in propane-pricing disparities that have made US and Canadian propane attractive to international markets. Not only have prices been under downward pressure—with monthly Mont Belvieu spot prices in 2015-16 reaching lows not seen since 2002—the average spread between the posted Saudi Aramco contract price and the Mont Belvieu price widened to 65%, as propane recoveries by gas processing plants ramped up 2012-15.
Fig. 7 highlights the spread between the two benchmark propane prices over time.
Drawn by attractive basis-differential pricing, the US propane market was incentivized to export. Demand for terminal capacity has been almost fully subscribed and propane exports have reached all-time highs. In 2018, the US has become the world’s leading propane exporter. As the US competes with the Middle East for market share in the global propane and LPG trade, We expect downward pressure to remain on global LPG prices with limited downside to the Mont Belvieu benchmark.
Changing dynamics
With expanded exports, Mont Belvieu propane prices have increased, prompting basis-differential pricing closer to historical norms. The US propane market, however, is far from reaching equilibrium. Crude oil and natural gas production should continue increasing as the US asserts its production leadership role, increasing propane supplies as well.
Meanwhile, domestic consumption of propane is not projected to increase, as no obvious catalyst exists to generate major additional demand in propane’s traditional markets. In the residential and commercial sector, propane remains under pressure from natural gas and electricity to displace it as the fuel of choice for heating and cooking. In the industrial sector, where propane has traditionally been the preferred fuel for forklifts in warehouses and at ports, the switch to electric forklifts has reduced propane’s market. In the agricultural sector, propane is mostly used for corn and soybean crop drying, but any increase in demand is subject to the size of the corn area planted and how wet the growing season is. Propane consumption as a petrochemical feedstock is also decreasing as ethane crackers continue to replace flexicrackers. Several propane dehydrogenation (PDH) projects have been cancelled or delayed, further reducing the outlook for propane demand in the petrochemical sector.
Industrial, agricultural demand
Compressed natural gas and electric-powered forklifts are likely to limit propane’s future share of the forklift market as customers focus more-stringent environmental regulations and air-quality standards over time. Hydrogen-powered forklifts are the latest entrant into an increasingly diverse and competitive materials-handling equipment market. Lead acid batteries are being replaced with lithium ion and hydrogen technology for electric forklifts. Increased emphasis on environmental footprints is expected to produce favorable market conditions to increase sales of forklifts powered by electricity or hydrogen due to their zero-emission fuel attributes.
In the agricultural sector, where propane is used for crop drying, demand hinges on corn and soybean plantings and weather. Corn and soybean production has remained elevated relative to historical norms, which could lead to increased sector demand for propane during autumn, coupled with potential demand spikes if there is a wet growing season.
Record corn production in 2013, combined with a wet growing season, resulted in high propane demand for crop drying, which drew down propane inventories in PADD 2 towards yearend 2013, just before the polar vortex extreme-cold weather event during first-quarter 2014 (Fig. 8).
Transportation demand
The transportation sector has historically experienced growing demand for propane from fleet and school bus operators. While propane has in the past been the more attractive, lower-emission option to diesel for school buses, propane now competes with CNG, gasoline, and electric buses. Adding further downward pressure on propane bus sales, California—which is one of the major markets for propane-powered buses—has made its most recent California Air Resources Board (CARB) subsidies applicable to only zero-emission and renewable natural gas (RNG) vehicles. Incentive programs to promote electric-driven buses, shuttle buses, and delivery vans are in place in California, Colorado, Washington, New York, and Maryland.
Petrochemical demand
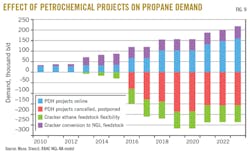
We expect demand for propane as a feedstock by petrochemical producers to be muted due to the cancellation of several PDH projects and the switch to ethane as feedstock for crackers. While the lightening of the cracker feed slate and new PDH projects coming online increased petrochemical propane demand by about 150,000 b/d in 2018, the PDH project cancellations and increased cracker ethane feedstock flexibility caused an estimated 220,000-b/d of propane demand to not materialize in 2018.
Fig. 9 shows the effect of petrochemical projects on propane consumption.
Effect of exports on price
US propane demand remained flat from 2010 to 2016 (with the exception of 2013) before starting to decline. Propane exports have increased to the point that 2017 export levels exceeded US domestic consumption. Despite concerns about the impact of this outlet on domestic propane prices, the Mont Belvieu annual average propane price did not track increased propane exports (Fig. 10). Rather, propane prices have tracked movements in pricing for the West Texas Intermediate (WTI) crude benchmark.
The authors
Ken Chow ([email protected]) is a senior principal in the midstream practice of global energy consultancy Muse, Stancil & Co., Houston, with more than 20 years of commercial and technical experience developing and operating assets in the upstream, midstream, LNG, and power-generation sectors. In addition to his consulting experience, Chow has worked for NextEra Energy, Williams Cos. Inc., and Enron Corp. in various managerial capacities. He holds a BS (1999) in mechanical engineering from McGill University, Montréal, Canada, and formerly served on the Gas Processors Association NGL Market Information Committee.
Ajey Chandra ([email protected]) is a director of Muse, Stancil & Co., Houston, and serves as managing director of the Houston office, where he also leads the midstream practice area for the firm. He joined Muse, Stancil in 2014 after 28 years’ experience in various facets of the midstream industry, including operations, engineering, business development, management, and consulting. Before joining Muse, Stancil, Chandra’s operating, consulting, and management experience included roles at Amoco Corp., Purvin & Gertz Inc., Hess Corp., and NextEra Energy Resources LLC. He holds a BS (1986) in chemical engineering from Texas A&M University and an MBA (1991) from the University of Houston. Chandra has also attended executive education classes at Harvard University and is a registered professional engineer in Texas.
PADD: US Petroleum Administration
for Defense Districts*
PAD District 1 (East Coast) consists of three subdistricts:
• Subdistrict 1A (New England): Connecticut, Maine, Massachusetts, New Hampshire, Rhode Island, Vermont.
• Subdistrict 1B (central Atlantic): Delaware, District of Columbia, Maryland, New Jersey, New York, Pennsylvania.
• Subdistrict 1C (lower Atlantic): Florida, Georgia, North Carolina, South Carolina, Virginia, West Virginia.
PAD District 2 (Midwest): Illinois, Indiana, Iowa, Kansas, Kentucky, Michigan, Minnesota, Missouri, Nebraska, North Dakota, South Dakota, Ohio, Oklahoma, Tennessee, Wisconsin.
PAD District 3 (Gulf Coast): Alabama, Arkansas, Louisiana, Mississippi, New Mexico, Texas.
PAD District 4 (Rocky Mountain): Colorado, Idaho, Montana, Utah, Wyoming.
PAD District 5 (West Coast): Alaska, Arizona, California, Hawaii, Nevada, Oregon, Washington.
*PADDs were delineated during World War II to facilitate oil allocation.
Source: US Energy Information Administration, Washington
