US olefins industry prepares for waves of new capacity
Dan Lippe
Petral Consulting Co.
Houston
From 2000-12, before the rise in natural gas and crude oil production from extensive North American shale plays, US petrochemical operators engaged in a cycle of capacity shutdowns and expansions dictated by the availability and economics of processing either light or heavy feeds.
After more than 15 years of plant closures, retrofits, and incremental expansions, however, producers wholeheartedly have embraced light feeds, especially ethane, as the preferred feedstock for ethylene plants in the US Gulf Coast market. The industry also has committed $15-20 billion dollars of capital investment to develop 15-20 billion lb of new ethylene capacity, most of which will be based on light feeds, and specifically, purity ethane. During the next 24 months, US ethylene producers will start up 12.4 billion lb of capacity vs. capacity expansions of 8.9 billion lb in 1990-94 and 9.9 billion lb 1995-99, the last two periods of major greenfield expansion.
In preparation for completion and startup of an equivalent volume of derivatives capacity in advance of the new ethylene capacity, US ethylene producers completed several major turnarounds in second-half 2016. Although producers also operated several plants at 100-110% of nameplate capacity, downtime resulting from the heavy turnaround schedule limited ethylene production during the period.
Ethylene production
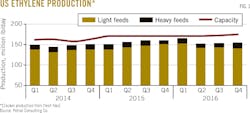
Petral Consulting Co. tracks US ethylene production via a monthly survey of operating rates and feed slates. Results of the monthly survey showed ethylene production was 153.7 million lb/day in third-quarter 2016, up 218 million lb (1.6%) from the second quarter. For fourth-quarter 2016, survey results showed ethylene production at 154.9 million lb/day, 111 million lb (0.8%) more from the previous quarter.
Compared with the same quarters in 2015, US ethylene production was 627 million lb (4.2%) lower in third-quarter 2016 and 557 million lb (3.8%) lower in fourth-quarter 2016 (Table 1).
Ethylene production from plants in Texas during third-quarter 2016 was 109.1 million lb/day before falling to 108.5 million lb/day in the fourth quarter. Production from ethylene plants in Louisiana averaged 40.3 million lb/day in third-quarter 2016 but slipped to 39.6 million lb/day during the fourth quarter. Scheduled maintenance was the primary constraint on ethylene output from both Texas and Louisiana plants during second-half 2016.
Fig. 1 shows trends in ethylene production.
Feedstock prices
The spot-price basis for heavy ethylene feedstock in second-half 2016 was stronger vs. first-half 2016 amid consecutive price rallies for West Texas Intermediate (WTI) crude during the spring and summer. By early October, however, WTI spot prices had weakened slightly to a range of $44-45/bbl amid declining expectations that the Organization of Petroleum Exporting Countries (OPEC) would curtail production, a surprise decision it announced in late November.
Spot prices for natural gasoline (representative for light paraffinic naphtha feeds) were 100-101¢/gal at the beginning of second-half 2016 but slipped to 95-98¢/gal during third-quarter 2016. As crude oil prices rebounded to $50/bbl in October and unleaded regular gasoline prices recovered to 149¢/gal, natural gasoline prices tracked the rally in the motor gasoline market, rising to 109¢/gal during fourth-quarter 2016.
From a second-quarter 2016 average of 49¢/gal, propane spot prices in Mont Belvieu, Tex., during third-quarter 2016 varied within a narrow range of 45-50¢/gal for a slightly weaker quarterly average of 48¢/gal. During fourth-quarter 2016, however, spot propane prices rebounded to a range of 54-64¢/gal to average 59¢/gal for the quarter.
During a rash of prebuying activity by producers in second-quarter 2016, spot prices for purity ethane rose to 23¢/gal in June before weakening to average 19¢/gal in the following quarter. As third-quarter 2016 ended, spot prices for purity ethane increased to 20¢/gal and averaged 24¢/gal during the fourth quarter.
Spot prices for the three major ethylene feedstocks (ethane, propane, light naphtha) all trended higher in second-half 2016, contributing to higher ethylene production costs during the period. Ethylene production costs, on a feedstock basis in second-half 2016, averaged 6-8¢/lb for purity ethane, 11-14¢/lb for propane, and 13-16¢/lb for natural gasoline. Based on ethylene yields-but before accounting for coproduct credits and fixed cash costs-raw material costs were 8-11¢/lb for purity ethane, 24-34¢/lb for propane, and 50-60¢/lb for natural gasoline.
After monthly price variations of less than 2¢/lb in first-half 2016, various factors combined to produce big swings in spot prices for polymer-grade propylene during the second half of the year. These factors included declining inventory in reportable US Gulf Coast storage, ongoing curtailment of refinery-grade propylene supply by some Gulf Coast refineries, and a surge in waterborne monomer exports.
At the beginning of third-quarter 2016, spot prices for polymer-grade propylene were 30-31¢/lb. Prices surged in August and September, reaching a peak of 41-43¢/lb from mid-August through mid-September. Pricing trends for refinery-grade propylene were similar during the third quarter, increasing from 20¢/lb in late June to 22¢/lb in early August before peaking at 33¢/lb in early September, according to PetroChem Wire's daily olefin price report.
As prices ran up, international buyers curtailed lifting cargoes of propylene monomer, and as exports collapsed, prices for both refinery-grade and polymer-grade propylene fell sharply during fourth-quarter 2016. From the September peak of 41-43¢/lb, polymer-grade propylene prices fell to 29-30¢/lb in late November and early December. Refinery-grade prices for propylene fell to 16-17¢/lb by mid-November, remaining in this range through yearend.
Contract settlements for purity butadiene averaged 38.5¢/lb in third-quarter 2016 before increasing to 49¢/lb during the fourth quarter. The jump in contract prices for butadiene in late 2016 accelerated in January 2017, when contracts settled at 64¢/lb. Trends in butadiene imports in July and September fell 35-40% below the average for first-half 2016.
Spot prices for aromatics were generally higher during the third and fourth quarters of 2016 vs. first-half 2016. Benzene prices averaged 229¢/gal (26-32¢/lb) in third-quarter 2016 and 238¢/gal in the fourth quarter, while spot prices for toluene rose to 203¢/gal in fourth-quarter 2016 from 191¢/gal in the third quarter.
Ethylene production costs based on purity ethane feeds were 10¢/lb in third-quarter before increasing to 12¢/lb in the fourth quarter. During third-quarter 2016, purity ethane provided a cost savings of 8.5¢/lb vs. natural gasoline and a savings of 12¢/lb in the last quarter of the year. Production costs for purity ethane were about 2¢/lb more vs. propane in the third quarter before falling to 1.5-2.0¢/lb less in the final quarter.
Production costs for purity propane were 8.5-9.0¢/lb in third-quarter 2016 and rose from 12-14¢/lb in October and November to nearly 18¢/lb in December. Production costs for propane in third-quarter 2016 were 10¢/lb lower vs. natural gasoline, and despite doubling during the fourth quarter, remained 12¢/lb less than costs for natural gasoline in October and 8¢/lb less in November-December.
Production costs for natural gasoline declined by 4¢/lb during third-quarter 2016, falling from 21¢/lb in July to a low of 17¢/lb in September for an average of 19¢/lb (7.5¢/lb lower from second-quarter 2016). These costs rose to 24¢/lb in the fourth quarter (Table 2).
Ethylene pricing, profit margins
Spot prices for ethylene generally fluctuate within a range defined by cash costs for higher-cost feedstock. The low end of the range is determined by the cash cost for high-cost feedstock with margins in a range of -5¢/lb to +5¢/lb. The high end of the range is determined by cash cost plus margins of 10-15¢/lb. During the past 20 quarters (2012-16), margins exceeded 15¢/lb in only two quarters (third and fourth-quarters 2014) and were less than zero in only one quarter (fourth-quarter 2015).
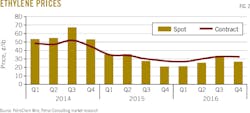
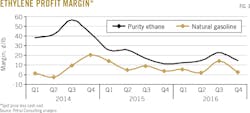
US Gulf Coast ethylene production remained almost flat in second-half 2016 to average only 2.2% lower from the first 6 months of the year. Pricing and trends, however, indicated the supply-demand balance was significantly tighter in third-quarter 2016 vs. the second or fourth quarters. Spot prices during the third quarter were 27-28¢/lb in July before rallying to 37-38¢/lb in September. Margins were 6-7¢/lb in July but increased to 15-21¢/lb in August and September. In fourth-quarter 2016, spot prices averaged 26.7¢/lb, with differential pricing returning to discounts below contract prices. Margins were 6¢/lb in October but were 0.6¢/lb below breakeven in December.
Fig. 2 shows historical trends in ethylene spot prices and net transaction prices (NTP). Fig. 3 shows profit margins based on spot ethylene prices and production costs.
Olefin-plant feed slate trends
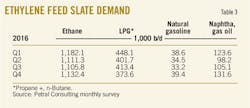
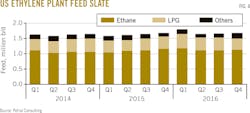
Petral Consulting's monthly survey of plant operating rates and feed slates showed industry demand for fresh feed averaged 1.67 million b/d in third-quarter 2016 and 1.68 million b/d in the fourth quarter. Third-quarter demand for fresh feed was 17,000 b/d (2.4%) more than second-quarter 2016, while fourth-quarter demand averaged 5,600 b/d higher than the third quarter.
Demand for NGL feeds (ethane, propane, and normal butane) was 1.53 million b/d in third-quarter 2016 and 1.50 million b/d in the fourth quarter. While demand for NGL feed in the third quarter was 11,400 b/d more than in second-quarter 2016, fourth-quarter demand fell to 29,000 b/d below third-quarter demand. NGL feeds accounted for 90-92% of fresh feed during second-half 2016 (Table 3).
Fig. 4 shows historical trends in ethylene-feed demand.
US propylene production
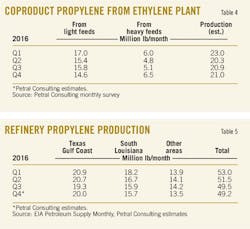
Coproduct propylene supply depends primarily on the use of propane, normal butane, naphtha, and other heavy feeds. The monthly survey showed demand for LPG feeds (propane and normal butane) in third-quarter 2016 was 427,200 b/d and declined by about 55,000 b/d to 372,000 b/d during the fourth quarter.
Demand for heavy feeds was 138,300 b/d in third-quarter 2016, or 5,600 b/d higher than the second quarter. In the fourth quarter, demand increased by another 34,700 b/d to 173,000 b/d. Total demand for feeds with high-propylene yield was 565,500 b/d in third-quarter 2016 and 545,000 b/d in the fourth quarter.
Petral Consulting estimates overall coproduct supply was 20.9 million lb/day in third-quarter 2016 and 21.1 million lb/day in the fourth quarter. Although fourth-quarter demand for all high-yield feeds was 20,000 b/d lower vs. the third quarter, the rebound in demand for heavy feeds was enough to boost coproduct supply by 0.2 million lb/day.
Coproduct supply from NGL feeds was 15.8 million lb/day in third-quarter 2016 before falling to 14.5-14.7 million lb/day during the fourth quarter. Coproduct supply from NGL feeds accounted for 76% of total coproduct supply in the third quarter but only 69% in the fourth quarter. Production from NGL feeds in third-quarter 2016 was only 50 million lb (3.5%) up from the second quarter, while fourth-quarter production was 114 million lb (7.8%) lower from the preceding quarter (Table 4).
PDH plants, refineries
Based on PetroChem Wire's daily reports, Petral Consulting estimates propylene production from PDH plants at the US Gulf Coast was 6 million lb/day in third-quarter 2016 and 8 million lb/day in the fourth quarter, with overall production for second-half 2016 averaging 7 million lb/day.
Total production for third-quarter 2016 was 100 million lb (22%) more than second-quarter 2016, while fourth-quarter production was 185 million lb (33%) higher than the third quarter. The increase in propylene production from PDH plants during third-quarter 2016 helped offset a decline in refinery-propylene supply during the quarter.
Refinery propylene sales into the merchant market are a function of:
• Fluid catalytic cracking unit (FCCU) feed rates (most important variable).
• FCCU operating severity (important but not directly measurable).
• Economic incentive to sell propylene rather than use it as alkylate feed.
In the last 12-18 months, US Gulf Coast and Midcontinent refiners have become more sensitive to variations in pricing differentials between refinery-grade propylene and unleaded regular gasoline. In the current market of rising propylene supply from PDH plants and persistently weaker pricing vs. unleaded regular gasoline, some refiners are more likely to reduce refinery-grade propylene sales volumes.
Statistics from the US Energy Information Administration (EIA) show US refineries operated FCCUs at 5.05 million b/d in third-quarter 2016, an increase of 27,700 b/d (0.6%) from operational rates in second-quarter 2016.
EIA monthly and weekly statistics showed fourth-quarter 2016 refinery crude runs fell by 450,000-475,000 b/d from the previous quarter to 16.0-16.2 million b/d. Petral Consulting estimates fresh feed to FCCUs declined to 4.9-5.0 million b/d during the fourth quarter.
Regionally, EIA statistics showed feed rates for FCCUs in the US Gulf Coast and Midcontinent at 3.73 million b/d in third-quarter 2016, only 4,700 b/d (0.8%) higher than second-quarter 2016. Petral Consulting estimates feed rates for these FCCUs were 3.70-3.72 million b/d in fourth-quarter 2016.
Spot prices for refinery-grade propylene in the Houston Ship Channel market fell 2-3¢/lb below unleaded regular gasoline prices in July 2016 to 19-21¢/lb. As prices for polymer-grade propylene surged in August-September, refinery-grade propylene prices also increased, rising to 26¢/lb in August and 33¢/lb in September, according to PetroChem Wire.Unleaded regular gasoline prices in the Gulf Coast pipeline market, however, remained stable, averaging 22-24¢/lb.
While refiners historically have increased merchant sales of refinery-grade propylene when prices jumped from discounts to premiums of 10¢/lb vs. unleaded regular gasoline prices, this was not the case during second-half 2016.
In third-quarter 2016, refinery-grade propylene supply from Gulf Coast and Midcontinent refiners was 42.8 million lb/day, or 2.6 million lb/day (5.7%) less than the previous quarter. Third-quarter sales ratios (100-lb refinery-grade propylene sales/bbl of FCCU feed) vs. second-quarter 2016 were 4% lower for Gulf Coast refineries and 7.2% less for Midcontinent refineries.
Spot pricing for refinery-grade propylene in fourth-quarter 2016 weakened alongside a decline in polymer-grade propylene prices, with premiums to unleaded regular gasoline prices slipping to 4-5¢/lb in October before moving to discounts of 2.3¢/lb and 9¢/lb in November and December, respectively. Petral Consulting estimates refinery-grade propylene supply from Gulf Coast and Midcontinent refineries was 42.5-43.0 million lb in fourth-quarter 2016 (Table 5).
Propylene economics, pricing
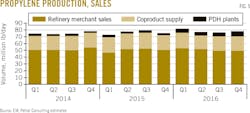
EIA statistics for refinery-grade propylene and Petral Consulting estimates for coproduct supply and PDH plant production show total US propylene production of 76 million lb/day in third-quarter 2016 and 79-80 million lb/day in the fourth quarter. The most significant changes in US propylene supply for second-half 2016 vs. 2015 resulted from increases in refinery supply and PDH plant production.
Fig. 5 shows trends in coproduct supply, PDH plant production, and refinery merchant sales of propylene.
Two factors greatly influence propylene pricing. Refinery-grade propylene supply tracks seasonal variations in refinery crude runs and FCCU feed rates. These variations in crude runs and FCCU feed rates are reasonably predictable, and propylene supply-demand balances are usually tighter in winter than in summer.
Propylene price relationships vs. unleaded regular gasoline vary directly with seasonal variations in the propylene supply-demand balance.
Under normal market conditions, propylene in reportable US Gulf Coast storage varies by ±25% of the midrange of long-term historic inventory levels. Occasionally, however, inventory levels fall outside the historic range. When inventory in reportable storage at the Gulf Coast increases to more than 770 million lb, spot prices for refinery-grade propylene tend to decline and premiums vs. unleaded regular gasoline weaken.
On July 1, propylene inventory in reportable Gulf Coast storage was 606 million lb, 11% below the 3-year average, while refinery-grade propylene prices were at discounts of 2.5-3.0¢/lb vs. unleaded regular gasoline prices, according to EIA statistics. For third-quarter 2016, EIA data showed inventory in reportable Gulf Coast storage fell to 407 million lb on October 1, or 40% below the 3-year average. The 200-million lb inventory drop was a strong indication of a tightening in the supply-demand balance.
Although refinery-grade propylene supply from Gulf Coast and Midcontinent refineries during the third quarter was 2.6 million lb/day less than in second-quarter 2016, coproduct and PDH supply was up 1.6 million lb/day. Demand was the variable tipping the market balance.
In the face of chronically weak prices and anticipation of ongoing supply growth, propylene monomer exports increased to 3.4 million lb/day in third-quarter 2016, or 0.93 million lb/day higher vs. the second quarter. Third-quarter polypropylene exports were 6.9 million lb/day, up 1.02 million lb/day on the quarter. But monomer imports (all from Canada) jumped to 1.86 million lb/day during the third quarter, while polypropylene imports-the other major piece of the puzzle-declined to 1.25 million lb/day, or 1.3 million lb/day lower than second-quarter 2016.
Propylene buyers and sellers anticipate predictable changes in supply due to plant turnarounds and seasonal variations in refinery-grade propylene supply. The market, however, is less able to anticipate changes in demand or exports. The balance of changes in international trade during third-quarter 2016 was the primary reason for a substantial liquidation of inventory in reportable Gulf Coast storage.
Likely anticipating peak seasonal supply of refinery-grade propylene, buyers were caught unaware. The combined impact of these developments pushed spot prices for polymer-grade propylene to a high of 41¢/lb in September, with pricing for refinery-grade propylene jumping to 33¢/lb. Prices in third-quarter 2016 were 37¢/lb for polymer-grade propylene (7.5¢/lb higher vs. second-quarter 2016) and 26.3¢/lb for refinery-grade propylene (6.6¢/lb higher vs. the second quarter).
Despite the higher prices, however, the volume of fixed-price trades for both polymer-grade and refinery-grade propylene increased during third-quarter 2016, according to PetroChem Wire. Third-quarter fixed-price trades (current month plus first forward month) for polymer-grade and refinery-grade propylene were up 17% and 20%, respectively, vs. the second quarter.
This confluence of bullish influences on the demand side collapsed in fourth-quarter 2016, weakening the price of polymer-grade propylene by about 5¢/lb from the third quarter to a fourth-quarter average of 33.7¢/lb. Spot prices for refinery-grade propylene in fourth-quarter 2016 averaged 21.4¢/lb, or 3¢/lb lower than the third quarter.
Polymer exports
The most important end-use markets for ethylene and propylene are producers of polyethylene and polypropylene. US polyethylene and polypropylene production has exceeded domestic demand for at least 30 years, and export markets have always absorbed the surplus in US supplies.
During 2017-2020, petrochemical companies in North America will start up 20 billion lb/year of new ethylene and polyethylene capacity. Since polyethylene demand in domestic markets remains stagnant, US exports of ethylene based products such as polyethylene and ethylene glycol will become increasingly important. Recognizing the need to prepare for the surge, producers and chemical industry marketing firms began increasing exports of key derivative products in second-half 2015.
US chemical companies also plan to increase PDH capacity by 4 billion lb/year (12 million lb/day). In contrast to equivalent expansion of ethylene-derivatives capacity for new ethylene plants, most projects to expand PDH capacity do not include any equivalent expansion of propylene-derivatives capacity. PDH producers instead will export polymer-grade propylene to maintain a balanced market at the US Gulf Coast.
Polyethylene
According to US International Trade Commission (ITC) statistics, US exports of polyethylene (high-density polyethylene, low-density polyethylene, and linear low-density polyethylene) in third-quarter 2016 fell to 22.1 million lb/day after averaging 24-25 million lb/day from fourth-quarter 2015 to second-quarter 2016). ITC statistics for October-November showed polyethylene exports fell again in fourth- quarter 2016 to 19.0-19.5 million lb/day.
Just as exports to destinations outside North America (rest of world, or ROW) drove total exports to record-high volumes during first-half 2016, exports to these destinations accounted for the decline in total exports in second-half 2016. During the third quarter, exports to ROW destinations fell to 11.4 million lb/day, or 2.86 million lb/day (20%) lower vs. the second quarter. Exports to Canada and Mexico were 10.7 million lb/day in third-quarter 2016, remaining within the 9.5-11.0-million lb/day range of exports during the five previous quarters. In fourth-quarter 2016, however, exports to Canada and Mexico fell to 9.0-9.3 million lb/day, with exports to ROW destinations also declining, to average 10.0-10.5 million lb/day.
First-half 2017
The planned commissioning of five new plants will dominate production trends and variability in 2017-18.
Occidental Chemical Corp. and Mexichem SAB de CV remain on schedule to commission their 50-50 joint venture Ingleside Ethylene LLC's 1.2 billion-lb/year ethane cracker at Ingleside, Tex., with the project's first phase due for startup in early 2017, according to the latest official statements from the companies.
In fourth-quarter 2016, LyondellBasell Industries NV completed a 50% expansion of ethylene capacity (0.8 million lb/year) at its complex in Corpus Christi, Tex., while Dow Chemical Co. finished the capacity expansion (0.6 million lb/year) of its petrochemical plant in Plaquemine, La.
While no new plants are scheduled for startup in second-quarter 2017, production from the Occidental-Mexichem JV should increase gradually across the quarter, reaching full capacity in the second of half of the year. Four more new plants with a combined nameplate capacity of 12.4 billion lb/year are scheduled to complete construction and begin commissioning activities during second-half 2017.
Petral Consulting expects US ethylene production will average 160-165 million lb/day in first-half 2017 and 168-172 million lb/day in second-half 2017. Production in first-half 2017 will be 5-8 million lb/day (about 1.5 billion lb) higher than second-half 2016.
New polyethylene plants that backstop new ethylene capacity will reach startup before associated ethylene production enters commissioning. Ethylene demand likely will surge, with a corresponding tightening in ethylene supply-demand balances. The transition to a chronically unbalanced market may not occur until second-half 2017.
In propylene markets, no additional PDH capacity is scheduled for startup until second-half 2017. In first-half 2017, US propylene supply will be determined by merchant refinery-grade propylene sales, coproduct supply from ethylene plants, and production from existing PDH capacity. Petral Consulting expects US propylene supply in first-half 2017 to be 1-3 million lb/day less than first-half 2016. In second-half 2017, US propylene supply will be 2-5 million lb/day more than in second-half 2016 if Enterprise Products Partners LP remains on schedule with the startup of its new PDH plant in Mont Belvieu (OGJ Online, Jan. 30, 2017).
Pricing and economics for ethylene and propylene will depend much more on supply-demand imbalances than on production costs. Price swings in the next 18-24 months for ethylene and polymer-grade propylene likely will exceed those that occurred in 2013-16. During first-half January 2017, for example, spot prices for polymer-grade propylene jumped 14¢/lb from the end of 2016. The biggest month-to-month change in 2016 was 9¢/lb between July and August.
Variability in motor gasoline pricing, however, will remain within normal historical ranges, resulting in higher premiums and deeper discounts for refinery-grade propylene relative to the price of unleaded regular gasoline.
Feedstock prices, coproduct values, and ethylene plant yields determine ethylene production costs. Petral Consulting maintains direct contact with the olefin industry and tracks historic trends in spot prices for ethylene and propylene. We use a variety of sources to track trends in feedstock prices. Some ethylene plants have the necessary process units to convert all coproducts to purity streams. Some ethylene plants, however, do not have the capability to upgrade mixed or crude streams of various coproducts and sell some or all their coproducts at discounted prices. We evaluate ethylene production costs in this article based on all coproducts valued at spot prices.
The author
Daniel L. Lippe ([email protected]) is president of Petral Consulting Co., which he founded in 1988. He has expertise in economic analysis of a broad spectrum of petroleum products including crude oil and refined products, natural gas, natural gas liquids, other ethylene feedstocks, and primary petrochemicals.
Lippe began his professional career in 1974 with Diamond Shamrock Chemical Co., moved into professional consulting in 1979, and has served petroleum, midstream, and petrochemical industry clients since. He holds a BS (1974) in chemical engineering from Texas A&M University and an MBA (1981) from Houston Baptist University. He is an active member of the Gas Processors Suppliers Association.


