Shell uses Raman spectrometer to evaluate Marcellus gas
Grant A. Myers
Usman Ahmed
Peter H.O. Christian
John M. Pope
WellDog
Laramie, Wyo.
Shell International E&P Inc. and WellDog jointly ran two field trials in the Marcellus shale in northern Pennsylvania using a downhole reservoir Raman system (DRRS) and software that analyzed chemicals within the wellbore to estimate natural gas and ethane content.
Reservoir engineers evaluated DRRS for its effectiveness in identifying natural gas liquids (NGLs) in shale and sweet spots for dry gas and wet gas. The field trials helped engineers place laterals in the most productive gas intervals.
The DRRS logging tool integrated a wireline-conveyed Raman spectrometer and an analogue sensor to measure low hydrocarbon levels in water. DRRS can measure different gases, including methane and ethane, dissolved in water.
The tool used a laser to illuminate a chemical substance, causing either elastic scattering or inelastic scattering. Elastic scattering is Rayleigh scattering while inelastic scattering is Raman scattering.
Raman spectroscopy provides a chemically-selective technique for identifying molecules through vibrational, rotational, and other low-frequency modes. Laser light interacts with molecular vibrations.
A photon-energy change causes a photon-frequency shift, providing readings that reveal molecular bonding and structure. The readings identify multiple chemical constituents (analytes) and measure each, including solubilized gases and other liquid hydrocarbons.
The direct laser-based technique generates a spectrum of embedded Raman signatures that identifies hydrocarbons and non-hydrocarbons during logging as a function of depth and time. DRRS measures concentrations of different gases, including natural gas liquids (NGLs) and other hydrocarbons, solubilized or diluted in fluids extracted from shale. Real-time readings distinguish levels of dissolved methane, free methane gas, and other light hydrocarbons in the wellbore or produced water.
Developers commercialized DRRS technology in 2005, initially using it for coalbed methane plays and coal mine methane. A third-generation DRRS completed in late 2012 features enhanced instrument sensitivity and better detection levels for use in shale plays.
Readings identified zones of highest resource density based on in-situ chemical composition and estimated partial pressure of hydrocarbons given their relative solubility in water.
Logistics, goals
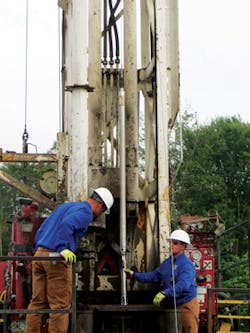
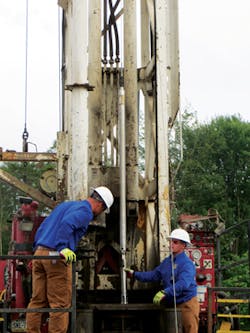
Workers ran Field Trial 1 during 2013 in an uncased well in McKean County, Pa., where the Marcellus is 25-30 ft thick. Several logging runs confirmed methane entering the well bore. The well was air-drilled to 5,000 ft TD through the base Marcellus and Onondaga limestone. The well's bottom rat hole was in Oriskany sandstone.
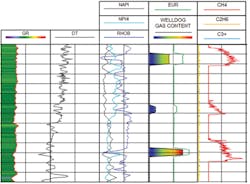
Field Trial 2 during 2015 involved a cased well in Potter County, Pa.., where the Marcellus shale is almost 100 ft thick. Spectral gamma-ray logging showed this Marcellus wellsite featured Basal, Middle Marcellus, and Upper Marcellus zones.
Three separate logging stages progressed vertically. Each zone measured about 10 ft in height. Perforated intervals were logged using the DRRS in both dynamic and static modes. Crews sealed perforated intervals using packers.
DRRS data defined plume formation, enabling engineers to estimate the methane mass entering the well per time unit. They also estimated hydrocarbon composition and relative richness at different stratigraphic intervals.
Field Trial 2 results showed the Upper Marcellus as the most productive interval and the best lateral location for a single completion.
Authors obtained solubility constants using proprietary tables based on gas type, reservoir pressure, temperature, and fluid-electrical conductivity. Concentrations of solubilized gases were compared with effective partial pressures of reservoir gases.
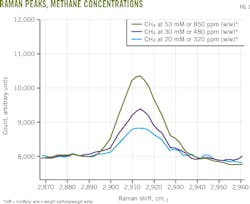
Crews calibrated surface and downhole instruments to determine hydrocarbon composition. Fig. 1 shows Raman peaks for methane dissolved in water at three different concentrations.
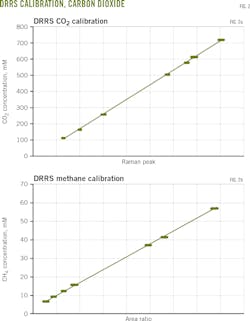
The Raman signature varied as a function of solute concentration while peak location was invariant. Different chemicals occupy unique locations in the DRRS spectra. The Raman peak varies for carbon dioxide in water (Fig. 2a) and methane in water (Fig. 2b).
A shale-evaluation protocol quantified concentrations of specific hydrocarbons and correlated the measurements to partial pressures and chemical compositions.
Researchers formalized a testing program enabling rapid, accurate, and inexpensive in-situ profiling of vertical and lateral variations in hydrocarbons and pore pressures. They also evaluated trends arising from shale interaction with wellbore fluids.
The project included three phases. Phase I involved laboratory testing of the technology's effectiveness at determining reservoir conditions. Phase II involved development of field trials. Phase III involved field trial deployment and DRRS result interpretation.
Technical hurdles remain before DRRS can be routinely used in all types of unconventional resource evaluation and assessment. One concern is potential interference with Raman spectra by background signals due to cyclic organic compounds and particulates, either from synthetic drilling fluid additives, completion fluids, or naturally occurring material in the reservoir fluid.
Researchers are working to suppress, mitigate, or avoid such background signal interference.
Laboratory simulations of subsurface reservoir conditions enabled testing of DRRS' ability to detect gaseous and solution-gas hydrocarbons. Lab tests also demonstrated the system's accuracy despite background signals.
Background spectra acquired from flowback water and fresh water at various exposure times showed no appreciable background signals despite high-turbidity in the flowback sample. This suggests DRRS can measure the spectral quality of water following shale contact.
Extensive testing showed DRRS readings to be undeterred by backscattered Rayleigh light in highly scattering circumstances within wellbore fluid.
Solubilized methane gas was in both flowback and fresh water samples. Raman peaks indicated that DRRS can detect solubilized methane in produced water. Raman readings of ethane gas solubilized in Marcellus flowback water samples were acquired at various partial pressures and exposure times.
Field-trial results
Workers carefully filled the well in Field Trial 1 with fresh water from the bottom up to prevent drilling debris dispersion into the water column. This precautionary measure before logging mitigated background signal potential, particulate scattering, and other optic noise.
DRRS readings verified an anticipated formation-wellbore fluid exchange. A total of 27 DRRS passes were done during three separate logging runs at logging speeds of 10-45 ft/min. Crews acquired additional DRRS readings during stationary surveys at various depths between logging passes.
Simultaneous measurements of conductivity, temperature, and pressure established trends in wellbore fluid chemistry and other fluid attributes. These measurements were taken throughout logging.
Methane entered the well bore over a very short vertical interval at about 4,757 ft, the top of the Lower Marcellus. Successive logging passes enabled backward extrapolation in time to locate the exact stratigraphic interval of methane entry into the wellbore to an accuracy of 2 ft.
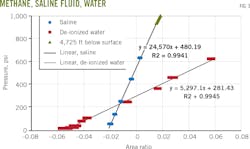
Salinity heavily influenced solubility of gases in water. The solubility in hypersaline brines was greatly diminished. An independent lab analyzed samples of the hypersaline brine influx acquired during Field Trial 1 for cation-anion composition.
DRRS tool calibration determined the upper limit of ethane that could be solubilized in the wellbore hypersaline brine at the in-situ pressure, temperature, and salinity.
Field Trial 2 involved a Marcellus section where the shale was almost 100 ft thick and featured three distinct lithotypes: Basal, Middle, and Upper Marcellus.
The DRRS pilot used a cased well that had been filled with water and left dormant. Crews replaced the wellbore water with clean surface water after pre-logging tests showed the wellbore water contained high rust levels. Targeted zones for perforation were selected based on the spectral gamma ray response and mud log values for methane and ethane.
The logging strategy was to perforate selected intervals sequentially up from the Basal zone using a 10-ft perforating gun fitted with deep penetrating charges at a 6 shots/ft density and 60° phasing for full-azimuthal coverage. Bridge plugs isolated each perforated zone.
Crews recorded the water volume lost due to the shale formation's fluid imbibition. Each logging run consisted of DRRS readings along with conductivity, temperature, and pressure measurements. Conductivity increased with time, consistent with Field Trial 1 results.
The conductivity increase stemmed from an influx of countercurrent ions generated through coupled osmosis-diffusion processes due to imbibition of water by the shale. DRRS peaks indicated free methane gas bubbles and solubilized methane. The presence of free methane gas confirmed high-resource density and production potential.
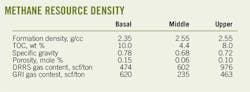
The authors found a new way to estimate resource density by computing the total mass of methane entering the wellbore using DRRS measurements and depth. Resource density is the total free and absorbed gas content. Adjustments to the estimate accounted for variation over time after perforation. Mass was equated to a gas volume at standard conditions and linked to the originating perforated rock volume, corrected for a number of physical and chemical properties of the reservoir and artifacts of the perforating process.
Resource-density estimation traditionally involves a model from the Gas Research Institute, Chicago. The model correlates bulk density with total organic carbon (TOC). This article's table compares resource density determined from the GRI model with the time-integrated methane flux measured by the DRRS.
De-ionized water
DRRS field trials confirmed a close temporal and spatial association between imbibition of fresh water by shale and countercurrent flow of ions and gas, driven principally by capillary action and an osmosis-diffusion process. The osmosis diffusion stems from disequilibrium in chemical activity of water and ions between diluted wellbore fluid and shale.
The partial pressure of methane must be close to or exceed the hydrostatic pressure for free gas to flow into a water-filled well, as demonstrated in the Upper Zone of Field Trial 2.
Field Trial 1 results showed well-developed organic porosity based on DRRS records of gas entering the well bore. Authors suspect this also was the case for the Upper zone in Field Trial 2. The trials detected no significant ethane.
DRRS can provide insights into the location and production capacity of light hydrocarbons in test wells.
It's tempting to speculate that, despite being 52 miles apart, both field trials confirmed a relatively thin Marcellus interval that appeared to deliver most of the gas detected during DRRS logging.
Crews should fill or flush the borehole with fresh surface water before logging to optimize the Raman spectrometer's sensitivity in low concentrations of light hydrocarbons and to help avoid complications from suspended particulates and synthetic mud additives.
The field trials demonstrated the need for DRRS tools to operate at higher pressures and temperatures for deeper formations. Wellbore fluid salinity was not an impediment to DRSS. Researchers tested its performance in conditions ranging from highly saline brine in Field Trial 1 to relatively dilute in Field Trial 2.
Calibrating the Raman response to brine salinity at a given pressure and temperature allowed calculation of formation water salinity. Very high formation water salinities might decrease sensitivity (Fig. 3).
Acknowledgment
WellDog acknowledges support from Shell International Inc. in the laboratory work and field trials outlined in this article.
Bibliography
Engelder, T., Cathles, L., and Bryndzia, L., "The fate of residual treatment water in gas shale," Journal of Unconventional Oil and Gas Resources, Vol. 7, September 2014, pp. 33-48.
Jenkins, C. and Boyer, C., "Coalbed- and shale-gas reservoirs," Society of Petroleum Engineers Journal of Petroleum Technology, Vol. 60, No. 2, February 2008, pp. 92-99.
Lamarre, R. and Pope, J., "Critical gas content technology provides coalbed-methane-reservoir data," SPE Journal of Petroleum Technology, Vol. 59, No. 11, November 2007, pp. 108-133.
Morgan, Q., Pope, J., and Ramsay, P., "Concurrent in-situ measurement of flow capacity, gas content and saturation," Australian Petroleum Production & Exploration Association Conference & Exhibition, Brisbane, Queensland, May 26-29, 2013.
Odusina, E., Sondergeld, C., and Rai, C., "NMR study of shale wettability," SPE Canadian Unconventional Resources Conference, Calgary, Nov. 15-17, 2011.
Pope, J., Buttry, D., Lamarre, R., Noecker, B., MacDonald, S., LaReau, B., Malone, P., Van Lieu, N., Perosli, D., Accurso, M., Harak, D., Kutz, R., Luker, S., and Martin, R., "Downhole geochemical analysis of gas content and critical desorption pressure for carbonaceous reservoirs," West Texas Geological Society Fall Symposium, Midland, Tex., Oct. 26-28, 2005.
Poth, C.W., "The Occurrence of Brine in Western Pennsylvania," Pennsylvania Bureau of Topographic and Geologic Survey, Bulletin, 1962, p. 53.
Renouf, P. and Pope, J., "Measuring gas content without cores," CBM Review, September 2011.
The authors
Grant A. Myers ([email protected]) is a senior spectroscopy scientist for WellDog where he leads the research and development of DRRS and Raman spectroscopy tools for unconventional and conventional reservoirs. He has more than 10 years experience in analytical chemistry and materials science laboratories. He earned a PhD (2012) in chemistry from the University of Utah.
Usman Ahmen ([email protected]) is WellDog executive technical advisor. He previously was a vice-president of global unconventional resources at Baker Hughes Inc. He holds an MS (1980) in petroleum engineering from Texas A&M.
Peter H. O. Christian ([email protected]) is WellDog vice-president of engineering and chief commercialization officer. He has more than 30 years experience. He holds an MBA (1997) from the University of Warwick's Business School.
John Pope ([email protected]) is WellDog founder, president, and chief executive officer. He has a PhD (1995) in physical chemistry from the University of Wyoming.