Part 1: Oil and gas company valuation, reserves, and production
Mark J. Kaiser, Yunke Yu, Center for Energy Studies, Louisiana State University, Baton Rouge
Editor's Note: This is Part 1 of a two-part series. Here, the authors introduce the variables and categorization levels used in the analysis, and summarize sample statistics. In March, Part 2 will explore the relationship between market capitalization, reserves, and production for majors and independents.
The primary determinants of the value of an oil and gas company are its reserves, level of production, and commodity price at the time of assessment. The purpose of this article is to establish the relationship between the factors that determine company value for a cross-section of publicly traded oil and gas companies for the year ending 2010. Oil and gas companies vary in the size of their reserves and production, earnings, growth potential, ownership, corporate and financial structure, degree of integration, and property portfolio, and all these factors potentially impact equity value. In Part 1, we introduce the variables and categorization levels used in the analysis, and summarize sample statistics.
Introduction
The value of an oil and gas company and/or property is intended to reflect the worth of the company and/or property on the open market. According to the 2005 International Valuation Standards, worth is defined as "the value of property to a particular investor, or class of investors, for identified investment objectives." The market value of a property is defined as the "estimated amount for which a property should exchange on the date of valuation between a willing buyer and a willing seller in an arms-length transaction after proper marketing wherein the parties had each acted knowledgeably, prudently, and without compulsion… reflecting the collective perceptions and actions of a market …".1
The primary value of any company is its cash flows and earnings, which is dependent upon the quantity and quality of the product that it provides, and the sales price. Production is derived from reserves and the inventory of capital assets, production equipment, infrastructure, and acreage. Reserves lie below the surface and have not yet been produced but are economically and technically viable to extract. In North America, the United States Securities and Exchange Commission (SEC), the Ontario Security Commission (OSC), Toronto Stock Exchange (TSE), and Canadian Security Administration (CSA) provide guidelines on resource classifications and company requirements to list on their stock exchanges.
Any member of society with enough money can buy shares of a public company, but a private company has only a few owners whose shares are not offered to the public. To estimate the value of a public company, there are four basic valuation techniques commonly employed – book value of assets, discounted cash flow, price earnings multiple, and market value – which can vary considerably depending on the assumptions used. For a private company, the first three methods are not an option because detailed financial information is not publicly released, but market comparisons are frequently utilized.
Proved reserves
The primary assets of oil and gas companies are their entitlements to future production from reserves, and one of the distinct features of the industry is its depleting asset base and need for replacement through drilling and acquisition. The physical attributes of the asset class – located miles under the ground in rocks with variable properties and uncertain boundaries, relying on indirect measurements that are expensive to perform – means that reserves estimates and deliverability are uncertain, and because future production is subject to variable production rates, unknown prices and cost, and is impacted by regulatory and fiscal uncertainty, the value of reserves are uncertain.
Proved reserves are defined as the estimated remaining quantities of oil and gas anticipated to be economically producible, as of a given date, by application of development projects to known accumulations under existing economic and operating conditions. In addition, there must exist, or there must be a reasonable expectation that there will exist, the legal right to produce or a revenue interest in the production, installed means of delivering oil and gas to market, and all permits and financing required to implement the project. Proved reserves estimates must be made with "reasonable certainty" and are defined conservatively in the sense that the reserves estimates are met. Engineering and geological data are needed to make the estimates, and generally speaking, the knowledge offered by greater amounts of engineering and geological data will improve the quality of the estimation.
The relative uncertainty of reserves is characterized by reference to deterministic categories – proved, P1 ("much more likely than not"); probable, P2 ("as likely than not"); and possible, P3 ("possible, but not likely") – or in probabilistic terms. If probabilistic methods are used, there should be at least a 90% probability that the quantities of proved reserves actually recovered will equal or exceed the estimate. For probable and possible reserves, the exceedance probabilities are 50% for probable and 10% for possible reserves.
Proved reserves may be developed or undeveloped and are classified into Proved Developing Producing (PDP), Proved Developed NonProducing (PDNP), and Proved Undeveloped (PUD) categories. PDP reserves are expected to be recovered from completion intervals that are open and producing. PDNP reserves are expected to be recovered from completion intervals that are open at the time of the estimate but are not producing (shut-in) or completion intervals that are not yet open but behind existing wells (behind-pipe). PUD reserves are expected to be recovered from new wells on undrilled acreage or existing wells in new formations. Reserves that are undeveloped require significant capital expenditures to convert into producing fields and cash flow generating assets. PDP is the least risky and the most certain proved reserves class; conversely, PUD is the most risky and least certain proved reserves class.
Production
Production is the causal result of reserves and is an important measure of performance since it determines gross revenue, and when combined with costs, the cash flow and profitability of a property. Operators control production and generally produce at rates to maximize return on investment, but differences arise in how oil and gas is produced depending on location and level of production and market conditions. Companies may shut-in or curtail gas production to protect wellbore stability or because of low prices, while oil wells are almost always operated at full capacity. At the field level, production and reserves are not strongly correlated because production depends on the life cycle stage of the asset. At a corporate level, however, production and reserves are expected to be more closely related because fields of many different sizes, types and ages are aggregated, which smooth out the production and life cycle variations of development.
Categorization
Ownership
The international oil industry is a complex and dynamic combination of public and private ownership reflecting historic trends, national policy, and the strategic objectives of countries. Public corporations have broadly dispersed ownership while companies with concentrated ownership are privately owned. In the U.S., private companies are the most numerous and tend to be much smaller than publicly traded companies.
Large multinational oil companies are commonly referred to as International Oil Companies (IOCs). IOCs are listed on stock exchanges with 100% of their stock owned by the public. They publish annual reports and abide by regulatory rules of the stock exchange listing. National Oil Companies (NOCs) are owned entirely by state government and in contrast to IOCs, production, reserves, revenue, profitability, and other key variables are not publicly disclosed. Over the past decade, a third class of company has become increasingly popular – companies that are part public and part government owned – referred to as Government Sponsored Enterprises (GSEs). The publicly owned portion of GSEs provide production and financial data in annual reports.
Eni from Italy, Petrobras from Brazil, Statoil from Norway, and PetroChina from China are examples of GSEs. Some GSEs have shed all previous government ownership (e.g., BP, Total, Repsol, PetroCanada), while other GSEs continue to have varying degree of state ownership (e.g., Sinopec (76%), Eni (30%), PetroChina (86%), Statoil (63%), Petrobras (32%), GazProm (51%), Rosneft (89%), ONGC (84%)).
Strategy
NOCs dominate the global energy economy and control more than three-quarters of the world's oil and gas reserves and more than one-third of supply. Their structure, function and roles vary widely depending on the country's economic and political system, strategic objectives, reserves base, degree of privatization, and other factors. NOCs have broader constraints and obligations than public corporations and those that belong to OPEC are subject to restrictions on production via a quota system. Most NOCs develop local resources with the aid of international service companies and have limited joint venture activity; e.g., Saudi Aramco (Saudi Arabia), PEMEX (Mexico), Russia (Lukoil). Some NOCs such as Nigeria National Petroleum Company, KazMunaiGas, Petronas, and China National Petroleum Company are actively engaged with IOCs.
GSEs structure themselves as corporations, but their motivations are both commercial and political. GSEs actively seek investment funds and have a structure that allows them to access capital markets. Some companies were founded with the intention to manage and control the country's oil and gas development while other companies (Statoil, PetroChina, ONGC) pursue development internationally. Some GSEs are as technologically advanced as the majors. Petrobras, for example, is a world leader in deepwater development; Statoil is a leader in Arctic offshore and subsea technology.
Degree of integration
IOCs, NOCs and GSEs are integrated to various extent across upstream and downstream activities depending on their economic and political systems, reserves base, business strategy, domestic infrastructure, consumption needs, and related factors. Independents explore for, develop, and produce oil and gas, but do not own transportation or refinery or marketing operations. Companies that refine, transport, and/or market their petroleum products are referred to as integrated companies. All the major multinational IOCs are integrated although different strategies are employed. Some companies like BP and Chevron balance their production and refinery capacity, while other companies such as Exxon, Shell and ConocoPhillips have a much higher level of refinery throughput than their production business can provide; in these cases, they purchase additional crude for their refinery runs. Major exporting countries and NOC production capacity usually far exceeds their domestic refining capacity.
Reserves reporting
Government agencies and regulatory bodies in many countries have developed reserves reporting regulations prescribing how volumes are classified and which volumes are reported. In the US, the SPE/WPC/AAPG/SPEE Petroleum Resources Management System (PRMS) is an industry standard for classifying and reporting oil and gas reserves and resources.2
The SEC, the regulatory agency that oversees the U.S. stock market and the manner publicly traded companies evaluate and report their assets and cash flows, require that companies report proved developed and undeveloped and total proved reserves. On December 29, 2008, the SEC published revised rules for oil and gas reserves disclosures which now closely align with guidelines in PRMS.3
Reserves volumes and values for publicly traded US companies are attached to financial statements and disclosed annually on Form 10-K while foreign issuers trading as an American Depository Receipt file Form 20-F. Private companies have no reserves disclosure requirements. The regulatory oversight and transparency in reserves reporting for NOCs and GSEs vary widely. For some NOCs, reserves data is considered a state secret.
Assets
The total assets of a company refer to their book value and reflect the historical costs rather than current market value. Assets include surface facilities, equipment and infrastructure, processing plants, offshore structures, refineries, loading facilities, pipelines, and the cost of property and buildings. Capital equipment is often custom designed and permanently installed at specific fields and transport corridors and has little or no alternative uses. A company's balance sheet summarizes its financial position at a point in time and is a list of all its assets, liabilities, and equity.
Capital structure
The capital structure of a company refers to the combination of securities employed (debt and equity) to raise and maintain the capital assets required to conduct business. The degree to which a firm is funded by loans is known as leverage and is usually expressed as the debt equity ratio (D/E). Considerable variation exists in the capital structure of oil and gas companies and their D/E ratio. IOCs and GSEs use cash flow from operations as the predominant source of funds and are also active in the capital markets. Independents rely on revolving credit, long-term debt and equity securities, as well as cash generated by operations.
A company's D/E ratio is influenced by their participation across the supply chain, access to capital markets, business strategy and operational performance. A high debt ratio signifies a high risk for payment problems which can impede business growth and lead to liquidation. High indebtedness may prevent a company from obtaining additional financing to fund future working capital, capital expenditures, acquisitions, or other general corporate requirements. Aggressive-growth independents leverage their financial strength to capture business opportunities and may have D/E > 5, while more conservative companies operate within cash flows to avoid carrying interest-bearing debt and have a D/E < 0.5. Most IOCs maintain a balanced approach to leverage and company D/E ratios typically range between 0.5 to 1.5.
Technology application
Reserves and production are classified according to the geologic nature of the resource and the manner of its extraction. Conventional production occur from a discrete accumulation or set of accumulations that are bounded by a downdip water contact from which hydrocarbons in liquid or gaseous forms are extracted from medium to high permeable sands with conventional technology. Unconventional reservoir systems are often synonymous with "continuous" accumulations and include tight gas sands, shale gas, shale oil, and coalbed methane reservoirs. Unconventional oil and gas resources are abundant, but their development is particularly sensitive to technologic and geologic risk and commodity price. Unconventional fields are more expensive and risky to develop than conventional fields and are more difficult to characterize. When unconventional technologies and evaluation techniques become standard practice, unconventional resources will be classified as conventional.
Oil vs. gas company
Wells and fields are classified as oil or gas depending on the volume of produced gas (measured in cubic feet) per unit of produced oil (measured in barrels). We apply the same convention to reserves holdings and classify companies based on their relative mix of oil and gas reserves. Oil and gas proved reserves are denoted by Ro and Rg and companies with Rg/Ro < 10,000 cf/bbl are classified as oil companies; gas companies are identified by Rg/Ro > 10,000 cf/bbl.
Reserves volumes
Reserves are a measurable value of a company's worth and a basic measure of its life span. In 2010, majors each had more than 6 billion boe (Bboe) reserves while most independents held less than 200 million boe (MMboe). Independents with more than 200 million boe (MMboe) proved reserves are classified as large-cap companies. Top-tier independents have more than 1 Bboe reserves and include oil companies Apache, Devon, Anadarko, Marathon Oil, and Pioneer, and gas companies Chesapeake, EOG Resources, Talisman Energy, and Noble Energy.
Geographic diversification
Oil and gas development occurs in a variety of operating environments in countries with different political risks, and companies pursue different strategies to balance and optimize their asset portfolio. The areas/basins of operations describe the geographic diversification and political risks of a company.
Multinational independents are involved in several countries and regions, while small independents often specialize in one region where they have expert knowledge in geology and contracting terms. IOCs are globally diversified and most top-tier independents are active in several countries. Anadarko, for example, is one of the most diversified independents with areas of operation in the deepwater Gulf of Mexico, Algeria, Alaska, Brazil, China, Indonesia, Mozambique, and West Africa. Most NOCs have a strong regional focus, while many GSEs are similar to IOCs in their geographic coverage.
Summary statistics
Sample
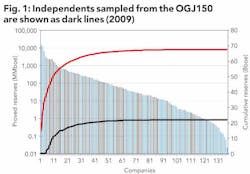
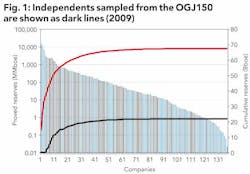
A random sample of 70 independents with headquarters in North America were considered along with seven majors. The independents were identified from the Oil and Gas Journal's OGJ150 (Figure 1) and other public sources and included a broad range of large and small producers.
Data source
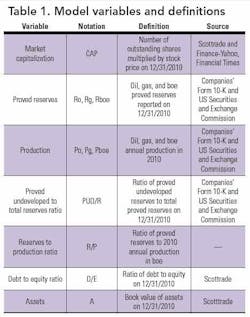
Market capitalization and D/E data was determined on December 31, 2010, using Scottrade, Finance-Yahoo, and Financial Times Global 500. Proved reserves and production data are collected from companies' annual reports for the year ending 2010. PUD/R and R/P are defined in terms of heat-equivalent reserves and production and were computed based on reported data; PUD/R is described as a percentage and R/P is described in years. Asset values were collected from annual reports and OGJ150.
IOCs
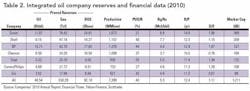
In 2010, the seven majors held reserves of 48.5 Bbbl oil and 258 Tcf gas; produced 7.4 Bboe, and had a R/P ratio of 12.4. Their combined market capitalization was $1.2 trillion with reported book value of assets of $1.4 trillion. The D/E ratio of the sample averaged 1.1 and 40% of proved reserves were undeveloped.
Exxon had the largest market capitalization on December 31, 2010 among IOCs at $369 billion followed by Shell at $209 billion, Chevron at $184 billion, BP at $137 billion, and Total at $125 billion (Table 1). All IOCs are primarily oil producing companies with Shell (Rg/Ro = 7.7) and Exxon (Rg/Ro = 6.8) having the greatest relative mix of gas reserves.
Exxon, Shell, BP, and Chevron held more than 10 Bboe reserves and produced more than 1 Bboe in 2010. PUD/R ratios ranged from 27% (ConocoPhillips) to 53% (Total); R/P ratios ranged from 10.5 (Chevron) to 14.8 (Exxon); D/E ratios ranged from 0.61 (Eni) to 1.87 (BP). The D/E ratios of Chevron (0.76) and Exxon (1.06) fell below the group average while ConocoPhillips (1.28) exceeded the average.
Independents
The 70 independents sampled represented 29 large and 41 small cap companies and 40 oil and 30 gas producers (Table 2). In total, the 70 independents held combined reserves of 30 Bboe, produced 2.3 Bboe, and had a combined market cap of $401 billion at the end of 2010.
Apache, Devon, and Anadarko are the largest independent oil companies in the world with proved reserves over 2 Bboe and more than 200 MMboe annual production, and market caps ranging from $34 billion (Devon) to $46 billion (Apache).
Chesapeake, EOG Resources, and Talisman Energy are the largest North American gas producing companies with reserves greater than 8 Tcfe and market caps ranging from $16.9 billion (Chesapeake) to $23.2 billion (EOG Resources).
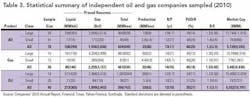
The average large-cap oil producer had 1.1 Bboe reserves, 88 MMboe production, and a market cap of $15.5 billion on December 31, 2010 while the average small-cap oil producer had 36 MMboe reserves, 3.5 MMboe production, and $787 million market cap. The large cap oil producers had a slightly smaller D/E ratio (1.1 vs. 1.7) and a slightly larger R/P ratio (12 vs. 10) compared to the small producer group and a smaller PUD/R percentage (34% vs. 53%).
The average large-cap gas producer held 861 MMboe reserves, produced 60 MMboe, and had a market cap of $10.2 billion on December 31, 2010 while the average small-cap gas producer had 61 MMboe reserves, 4.4 MMboe production, and $776 million market cap. Gas producers were similar in R/P and PUD/R ratios, but large producers had slightly higher average D/E ratios (1.3 vs. 1.1).
References
- International Valuation Standard 2005. 7th Edition. International Valuation Standard Committee, Washington, D.C.
- SPE/WPC/AAPG/SPEE, 2007. "Petroleum Resources Management System," available at:http://www.spe.org/industry/docs/Petroleum_Resources_Management_System_2007.pdf#redirected_from=/industry/reserves/prms.php
- US Securities and Exchange Commission. (US SEC) 2008. Modernization of the Oil and Gas Reporting Requirements. Confirming version (proposed rule), 17 CFR Parts 210, 211, 229, and 249, Release Nos. 33-8995; 34-59192; FR-78; File No. S7-15-08, RIN 3235-AK00, available at: http://www.sec.gov/rules/final/2008/33-8995.pdf.
About the authors


More Oil & Gas Financial Journal Archives Issue Articles
View Oil and Gas Articles on PennEnergy.com