The "Mother-Fracker" short
WHY DAVID EINHORN IS WRONG
HANWEN CHANG, NEXEN, HOUSTON
DURING THE 2015 Ira Sohn Foundation Conference in May, billionaire hedge-fund manager and founder and president of Greenlight Capital David Einhorn slammed US shale frackers, saying the companies have burned a lot of money over the past decade. According to Einhorn, the large frackers have collectively spent $80 billion more in capital expenditures than they have earned in revenues. Even when crude oil traded around $100 per barrel last year, Einhorn said, large frackers still burned $20 billion. He believes the over-spend will get worse as shale drillers eventually run out of optimal acreage to drill. In his view, Pioneer Natural Resources, a major tight oil producer in the Permian Basin and Eagle Ford and referred to as the "Mother-Fracker" in his presentation, is no different from its peers-an overvalued company using capital inefficiently.
The valuation of US independent E&P stocks may be a little high given where the current strip is. And it is true that the dramatic oil production growth from tight oil plays, which we have witnessed in the last few years, is unsustainable in the current price environment. But in my opinion, Einhorn has overlooked some critical petroleum industry attributes in his analysis. Here is a breakdown of four questionable points in Einhorn's analysis. Slide numbers from Einhorn's presentation (which can be found in its entirety at GreenlightCapital.com) are included for reference.
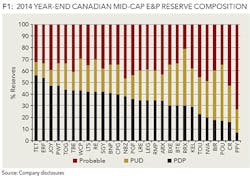
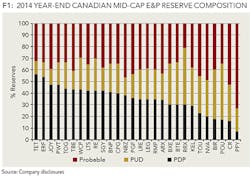
While blaming US shale frackers for destructing value, Einhorn neglects the value of Proven Undeveloped (PUD) and Probable reserves of these companies. In his calculation of average Net CAPEX/BOE developed of the past nine years (p. 36), he only used the PDP as denominator. All else equal, I prefer a high percentage of Proved Producing to 2P reserves as these are what generate cash flow and comprise the lending base. Oil and gas companies with large resource play exposure, like Pioneer and other shale frackers, however, typically have a larger proportion of PUD and Probable bookings. Since US oil and gas companies are not required to report Probable reserve data, I use Canadian Intermediate E&Ps as a proxy to understand the reserve composition of US shale frackers. The average percentage of PDP to 2P of the group is approximately 35% (See Figure 1). Of course, converting PUD and Probable reserve to PDP requires even more CAPEX in the future. But how can an operator increase its PDP reserve without a large inventory of PUD and Probable Reserves? Although PUD and Probable are more uncertain and worth less than PDP, they have been deeply priced-in in investors' valuation for Pioneer's stock.
Moreover, simply incorporating nine years of net capital expenditures as total development costs doesn't tell the whole story, and it is not the correct way to go about analysis in the upstream sector. Upstream companies front load their capital costs as they build midstream assets to transport, store, and distribute their hydrocarbon production. Thus, Einhorn equates costs that result in tangible assets with development costs. For example, on June 1st 2015, Pioneer sold its share of Eagle Ford midstream assets for $1 billion to Enterprise Products Partners LP and signed favorable midstream and downstream contracts with the latter.
Capital spending patterns are not the only way to analyze a company's performance and future. You have to acknowledge that all the up-front investments in land, seismic, infrastructure and capitalized overheads had the effect of diluting return on capital invested, but were required to facilitate development drilling, and that initial drilling required to hold acreage is less capital efficient that pure development drilling. Things change as CAPEX drops, and the investments start to generate production. In most of the newly-developed basins across the US, Pioneer is still in its infant stage in terms of production. On the whole, the US shale industry is in development mode, and continuous growth is witnessed in terms of efficiency improvement and operational growth. The future is not as bleak as portrayed in Einhorn's presentation.
Before the gas price collapsed, many shale frackers spent a lot of capital drilling for natural gas. But most of them have shifted to drilling for oil since then. The industry didn't even start drilling horizontally in the Permian until a few years ago. Even if Einhorn's calculation of Net CAPEX/BOE developed of the past nine years is correct, how is that relevant to future investments being made in horizontal Spraberry/Wolfcamp wells?
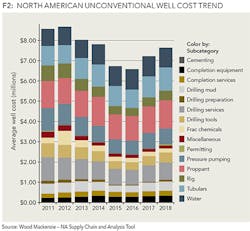
The oil and gas industry is a high-tech industry. Billions of dollars continue to be invested in R&D to lower costs and improve productivity. Einhorn believes that part of the improved economics achieved by shale oil producers in the current environment comes from 'cherry picking' best prospects first, and that the results should be an initial burst of apparent productivity improvement (p.56). That will be true to some degree, but it won't explain all of the improvement. Big chunks of the improvements actually come from sources that have nothing to do with where the companies choose to drill - they come from things like improved completion designs and drilling efficiency (see Figure 2). According to energy consulting company Wood Mackenzie, well costs have trended downward around 4%-5% per year in the big three unconventional plays (Bakken, Eagle Ford and Permian Wolfcamp). Recovery per well, as measured by EURs, has been rising in general.
As a result of drilling best acreage first, longer-term capital efficiency may actually deteriorate (p.57). That sounds logical in theory, but in practice natural gas producers in the Marcellus play went through a round of high grading a few years ago as gas price collapsed, yet their capital efficiency continues to improve. Look at Range Resources' presentations. You can find some detailed historical time series of capital efficiency metrics like CAPEX per incremental mcfe production, completion cost per lateral feet, drilling cost per lateral feet, etc. These metrics have moved in the right direction for several years, long after the effect of 'cherry picking' should have worn off.
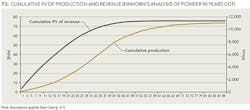
Einhorn's entire value thesis comes down to a discounted cash flow (DCF) analysis that projects Pioneer's business out 90 years to 2104 using an operational baseline from 2014/2015 (p.72). The oil and gas industry will adapt and evolve as it always has. Any attempt to make assumptions on how companies will run their businesses more than 5-10 years out is short-sighted and will lead to getting burned. In his DCF analysis (p.72), Einhorn kept commodity prices and costs flat after 2023 and applied a discount rate of 8.4% to calculate the present value of cash flows. Figure 3 is a chart of cumulative PV of revenue and production in Einhorn's base case. As you can see, cumulative PV of revenue remains stagnant after 2049 while production grows rapidly. It's no wonder the valuation derived for Pioneer is so small. You can't keep the price flat for 80 years and still discount the cash flow at 8.4% annually. Oil price was $2.93 50 years ago. Do you really think oil price will be $68.00 50 years from today? To assume perpetual production growth while pricing and cost remain static oversimplifies the cash flow.
I don't have a view on whether the stock of Pioneer Natural Resources is undervalued or overvalued. The aim in my analysis is to present an unbiased perspective for all investors and speculators following Eihorn's call on Pioneer. A call that I believe is misguided.
ABOUT THE AUTHOR
Hanwen Chang is a corporate development associate at Nexen. He holds a bachelor's degree from Northeastern University and a master's degree from Texas A&M University. Hanwen is a CFA charter holder and a member of the CFA Institute and CFA Society of Houston.
This article represents the views of the author. Any opinions expressed do not necessarily reflect the views of Nexen or any third party.


