EIA revises up oil price forecasts for 2019
Due to a slightly tighter global oil market, the US Energy Information Administration, in its latest Short-Term Energy outlook, forecasts Brent spot prices to average $65/bbl in 2019, up $2/bbl from last month’s STEO forecast, and $62/bbl in 2020. These compare with an average of $71/bbl in 2018.
EIA expects that West Texas Intermediate crude oil prices will average $8/bbl lower than Brent prices in the first half of this year before the discount gradually falls to $4/bbl late this year and through 2020.
Global oil market
Crude oil prices increased for the third consecutive month in March and are trading near the middle of the range established over the previous year.
Increasing crude oil supply disruptions and voluntary reductions in oil production from the Organization of Petroleum Exporting Countries are among the recent price drivers in the crude oil market. Saudi Arabia produced 9.85 million b/d in March, down by almost 900,000 b/d from October. Venezuela has experienced several prolonged electric power failures throughout the country, which has directly resulted in reduced crude oil production and exports.
Economic indicators have recently sent mixed signals, increasing uncertainty regarding the future direction of oil prices. Recent manufacturing Purchasing Managers’ Indexes (PMI) in several European countries are showing continued contraction in their manufacturing sectors. In the US, the Treasury yield curve inverted in March for the first time since 2007, a phenomenon that indicates a combination of tight monetary policy, investment risk aversion, and lower long-term economic growth expectations. However, manufacturing PMI surveys in the US and China increased in March, and the US Federal Reserve indicated it is unlikely to increase interest rates for the remainder of 2019, all factors that could signify a reversal of some of the negative economic indicators and support economic growth, and consequently crude oil prices.
Liquid fuels inventories
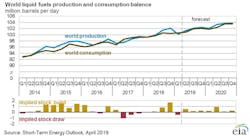
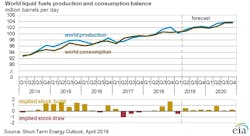
EIA estimates that global liquid fuels inventories declined by 700,000 b/d in March and by 500,000 b/d for the first quarter of this year, which would be the first quarterly stock draw since fourth-quarter 2017.
High compliance among OPEC and non-OPEC countries subject to voluntary oil production reductions has contributed to falling petroleum inventories in the Organization for Economic Cooperation and Development. OECD petroleum inventories are now lower than the 5-year (2014–18) average.
Withdrawals in global inventories are reflected in the increased backwardation in both Brent and WTI crude oil futures curves. Both the Brent and WTI 1st–13th month spreads reached 6-month highs as of the first week of April, settling at $3.24/bbl and $1.92/bbl, respectively, on Apr. 4. Some of the largest global inventory withdrawals occurred in the US and are likely contributing to the steepening of the WTI futures curve in particular.
US oil, gas supply-demand
EIA forecast US Lower 48 onshore crude oil production will average 10.5 million b/d in 2020, which is more than 200,000 b/d above the 2020 forecast in the March STEO. The higher crude oil production is the result of both higher forecast prices in 2019 that have a lagged effect on production and of data updates that increased drilling levels in the Permian basin.
Additionally, EIA forecasts Gulf of Mexico offshore crude oil production will average 2.1 million b/d in 2020, which is almost 200,000 b/d below the 2020 forecast in the March STEO. The lower forecast is the result of model adjustments that updated decline rate forecasts.
The net effect of these changes is that forecast total US crude oil production is 100,000 b/d more than in the March STEO.
EIA expects natural gas consumption to increase by 2.5 bcfd (+3%) in 2019, up from expected growth of 1.5 bcfd (+1.8%) in the March STEO. The forecast largely reflects higher consumption in the first quarter of 2019, because of estimated heating degree days for March that were higher than previously forecast. The colder-than-expected temperatures in March raised consumption of natural gas for space heating use in the residential and commercial sectors. In addition, EIA slightly raised its forecast growth of natural gas consumption in the industrial and electric power sectors for this year.
Working gas in underground storage declined to 1,161 bcf at the end of March, the lowest level since 2014, according to EIA estimates. However, EIA forecasts that steadily rising gas production will contribute to inventory builds outpacing the 5-year average during the 2019 injection season, which will bring natural gas inventories to 3,673 bcf at the end of October, 1% lower than the 5-year average compared with inventory levels that were 30% lower than the 5-year average at the end of March.
Prices at the Waha Hub in West Texas, near the Permian basin, averaged 73¢/MMbtu in March, $2.22/MMbtu lower than the average Henry Hub spot price during the same period. Multiple force majeures have constrained pipeline capacity and reduced westbound flows out of the Permian, which has put downward pressure on prices. Prices at the Waha Hub turned negative during the last week of March, and they fell to a record low of -$4.63/MMbtu on Apr. 3.
EIA expects additional gas pipeline capacity out of the Permian to come online later in 2019, which should help to stabilize prices at the Waha Hub.