EIA forecasts higher US crude oil production, lower prices
US crude oil production reached 11.3 million b/d in August and was 290,000 b/d higher than expected, according to the US Energy Information Administration’s latest Short-Term Energy Outlook. This higher level of production raised the baseline for EIA’s forecast for 2019 crude oil production, and EIA now expects US crude oil production to average 12.1 million b/d in 2019 compared with a forecast of 11.8 million b/d in the October STEO.
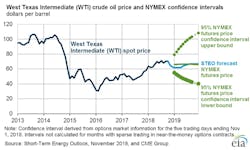
EIA forecasts Brent crude oil prices to average $72/bbl in 2019, which is $3/bbl lower than previously forecast. EIA expects West Texas Intermediate crude oil prices to average $65/bbl in 2019, which is $5/bbl lower than previously forecast. The lower crude oil price forecasts are partly the result of higher expected crude oil production in the US in this year’s second half and in 2019, which is expected to contribute to growth in global oil inventory and put downward pressure on crude oil prices.

EIA forecasts total global liquid fuels inventories will remain flat in 2018, followed by an increase of 600,000 b/d in 2019.
Meantime, Canadian oil production in July and August was higher than previously estimated, as updated analysis indicates that crude oil volumes EIA previously assumed were disrupted were online during those months. As a result, Canada’s total liquid fuels production for this year’s third quarter is more than 300,000 b/d higher than estimated in the October STEO.
Oil demand growth
Both Brent and WTI crude oil prices reached 4-year highs in early October given the uncertainty about the amount of Iranian crude oil supply coming off the market and whether other producers could make up for the shortfall.
However, increased indications of a global economic slowdown, as well as higher-than-expected global petroleum supply, contributed to rapid price declines later in the month.
Similarly to early 2018, financial markets exhibited major price volatility in October, contributing to selloffs in risk assets such as equities and commodities. Chinese economic growth was lower than expectations, and leading economic indicators for several countries have slowed, leading to market concerns over the pace of oil demand growth in the coming months.
Continued depreciation in emerging market countries’ currencies—which makes the cost of crude oil imports more expensive—have also put downward pressure on the petroleum demand outlook.
EIA is forecasting global petroleum and other liquid fuels consumption growth to average 1.4 million b/d in 2019, which is 100,000 b/d lower than forecast in the October STEO.
Oil supply
US crude oil production increased at a faster rate than EIA previously anticipated. Crude oil production reached a new monthly record of 11.3 million b/d in August, according to EIA’s latest Petroleum Supply Monthly. EIA now estimates that October US crude oil production averaged 11.4 million b/d compared with a forecast of 11 million b/d in the previous STEO.
Crude oil production in Saudi Arabia and Russia reached some of the highest levels in history last month, helping to offset the months of supply losses from Iran and Venezuela. Venezuela’s crude oil production declines have slowed and estimates of its crude oil exports have increased as its domestic refining system is operating at low utilization rates. Libyan production has resumed at a faster than expected rate because of improved security, and Libya has produced more than 1 million b/d for two consecutive months.
These supply developments have occurred when global refinery maintenance is typically at its highest for the year, contributing to an estimated global petroleum inventory build of 2 million b/d in October.
Refinery utilization in the US in October averaged 89% and commercial crude oil inventories increased by 22 million bbl from the end of September—the largest monthly increase since January 2017. The WTI futures curve is now exhibiting slight contango (when near-term futures prices are lower than longer-dated ones), and the entire curve has flattened considerably in recent months. The rapid flattening of the futures curve reflects the recent petroleum oversupply and lower demand.
US natural gas
EIA estimates dry natural gas production in US averaged 86.9 bcfd in October, up 700 MMcfd from September. EIA forecasts that dry natural gas production will average 83.2 bcfd in 2018, up 8.5 bcfd from 2017. Both the level and growth of natural gas production in 2018 would establish new records. EIA expects natural gas production will continue to rise in 2019 to an average of 89.6 bcfd.
EIA estimates that US natural gas storage inventories were 3.2 tcf at the end of October. This level was 16% lower than both the 2017 end-of-October level and the 5-year (2013–17) average for the end of October and was the lowest end-of October level since 2005.
Despite low storage levels, EIA expects strong growth in US gas production to put downward pressure on prices in 2019. EIA expects Henry Hub natural gas spot prices to average $2.98/MMbtu in 2019, down 4¢ from the 2018 average and down from a forecast average price of $3.25/MMBtu in this year’s fourth quarter.