EIA revises up crude oil price forecasts for 2018, 2019
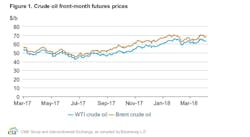
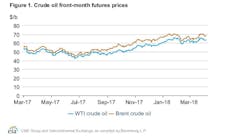
Brent crude oil spot prices averaged $72/bbl in April, an increase of $6/bbl from the March level and the first time monthly Brent crude oil prices have averaged more than $70/bbl since November 2014.
In its latest Short-Term Energy Outlook, the US Energy Information Administration forecasts that Brent crude oil spot prices will average $71/bbl in 2018 and $66/bbl in 2019. These are $7/bbl and $3/bbl higher, respectively, than in the April STEO. EIA expects West Texas Intermediate crude prices to average $5/bbl lower than Brent prices in both 2018 and 2019.
The movement of oil prices reflect the continuous drawdown of global petroleum inventories. Since January 2017, the beginning of the crude oil production cut agreement among certain countries within and outside the Organization of Petroleum Exporting Countries, global petroleum inventories have declined at an average rate of more than 500,000 b/d.
Excluding Libya, Nigeria, and Equatorial Guinea—countries not subject to the production reductions—OPEC countries produced an estimated 29.3 million b/d in April, the lowest levels since April 2015 and 400,000 b/d below the agreed-upon production reductions.
Oil prices may have also risen in anticipation of the potential reinstitution of US sanctions on Iran, which could contribute to declines in the country’s crude oil production (OGJ Online, May 8, 2018).
Further, strong global oil demand growth has added to upward price pressures. EIA estimates that global oil consumption in this year’s first quarter was 1.9 million b/d, or 2% higher than it was in first-quarter 2017.
Backwardation
Backwardation also increased in April and reached the highest levels since 2014, indicating high demand for immediate oil deliveries.
The increase in the backwardation of crude oil prices suggests there is an incentive for holders of oil in physical storage to sell on spot markets. Hence, STEO estimates that US commercial crude oil inventories in April were 1.5% lower than the 5-year average for that month, and total petroleum inventories in countries within the Organization for Economic Cooperation and Development are estimated to have ended April slightly below the five-year average.
Price spreads
Meantime, pipeline constraints in the Permian region continue to contribute to lower crude oil prices there relative to other regions. As production rises beyond the capacity of existing pipeline systems, producers must use more expensive forms of transportation, including rail and trucks. As a result, WTI Midland price spreads widened to the largest discount to Brent since 2014. The WTI Midland differential to Brent settled at -$17.69/bbl on May 3, which represents a widening of $9.76/bbl since Apr. 2.
US light, sweet crude oil priced outside of the Permian region also declined compared with Brent, but not to the same extent as WTI Midland crude oil. More negative US light, sweet crude oil differentials may suggest constraints including limitations in processing increasing amounts of this type of crude oil on the part of US refineries.
Midwest and Gulf Coast refinery inputs are at or near all-time highs for this time of year. Light Louisiana Sweet crude oil prices reached their lowest level compared with Brent prices in more than 2 years in late April, settling at -$1.59/bbl below Brent on May 3. WTI Cushing spot prices also fell relative to Brent, declining by $1.06/bbl from Apr. 2 to settle at $5.19/bbl on May 3.
In addition to some potential refinery constraints, infrastructure at export terminals on the US Gulf Coast could limit the scale of US crude oil exports in the near term. These low differentials may reflect the additional transportation costs to export light sweet crude oil to other regions such as Asia.
By mid-2019, EIA expects enough pipeline capacity will exist in the Permian region to transport crude oil to the USGC, eventually decreasing the spread between US and international crude oil prices.
US crude oil production
EIA forecasts that US crude oil production will average 11.9 million b/d in 2019, 400,000 b/d higher than forecast in the April STEO. The higher crude oil production forecast in 2019 reflects WTI crude oil prices that are expected to average $64/bbl during the second half of 2018 and first half of 2019, compared with last month’s forecast of $57/bbl during this period.
However, because crude oil prices in the Permian region are expected to remain markedly lower than WTI Cushing prices until mid-2019, EIA does not expect crude oil production growth in that region to rise as sharply as it would under a scenario with no transportation constraints.
Natural gas
US dry natural gas production averaged 73.6 bcfd in 2017. In the May STEO, EIA forecasts dry natural gas production will average 80.5 bcfd in 2018, establishing a new record. EIA expects natural gas production will rise again by 2.9 bcfd in 2019 to 83.3 bcfd.
EIA forecasts net natural gas exports to increase from 0.4 bcfd in 2017 to an annual average of 2 bcfd in 2018 and 4.6 bcfd in 2019.
EIA estimates that natural gas inventories increased by 22 bcf in April, ending the month 27% below the 5-year average for the end of April. If confirmed in the monthly data, the April injection would be the smallest April injection since 1983. Preliminary data indicate April temperatures were the coldest for that month in the past 21 years, which contributed to low injections.
In the latest STEO, EIA expects Henry Hub natural gas spot prices to average $3.01/MMbtu in 2018 and $3.11/MMbtu in 2019.